This page applies to Apigee and Apigee hybrid.
View Apigee Edge documentation.
Apigee enhances the availability of your APIs by providing built-in support for load balancing and failover across multiple backend server instances.
Target servers decouple concrete endpoint URLs from target endpoint configurations. Instead of defining a concrete URL in the configuration, you can configure one or more named target servers. Then, each target server is referenced by name in a target endpoint HTTPConnection.
Videos
Watch the following videos to learn more about API routing and load balancing using target servers
| Video | Description |
|---|---|
| Load balancing using target servers | Load balancing APIs across target servers. |
| API routing based on environment using target servers | Route an API to a different target server based on the environment. |
About the target server configuration
A target server configuration consists of a name, a host, a protocol, and a port, with an additional element to indicate whether the target server is enabled or disabled. A target server can also have an optional <sSLInfo> object.
The following code provides an example of a target server configuration:
{ "name": "target1", "host": "1.mybackendservice.com", "protocol": "http", "port": "80", "isEnabled": "true" }For more information on the TargetServers API, see organizations.environments.targetservers.
See the schema for TargetServer and other entities on GitHub.
Creating target servers
Create target servers using the Apigee UI or API as described in the following sections.
Apigee in Cloud console
To create target servers using Apigee in Cloud console:
- Sign in to the Apigee UI in Cloud console.
- Select Management > Environments.
- Select the environment in which you want to define a new target server.
- Click Target Servers at the top of the pane.
- Click + Create Target Server.
Enter a name, host, protocol and port in the fields provided. The options for Protocol are: HTTP for REST-based target servers, gRPC - Target for gRPC-based target servers, or gRPC - External callout. See Creating gRPC API proxies for information on gRPC proxy support.
Optionally, you can select Enable SSL. See SSL certificates overview.
- Click Create.
Classic Apigee
To create target servers using the classic Apigee UI:
- Sign in to the Apigee UI.
- Select Admin > Environments > TargetServers.
- From the Environment drop-down list, select the environment to which you want to define a new target server.
The Apigee UI displays a list of current target servers in the selected environment:
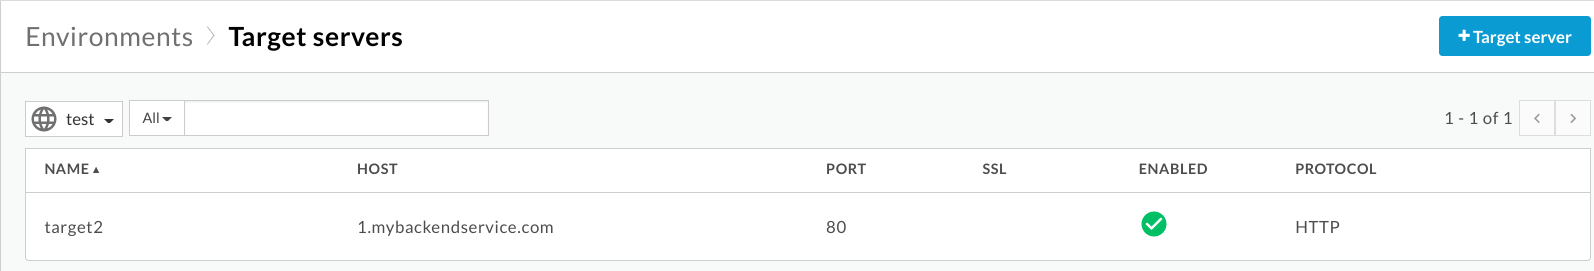
- Click +Target server to add a new target server to the selected environment.
The Add target server dialog box displays:
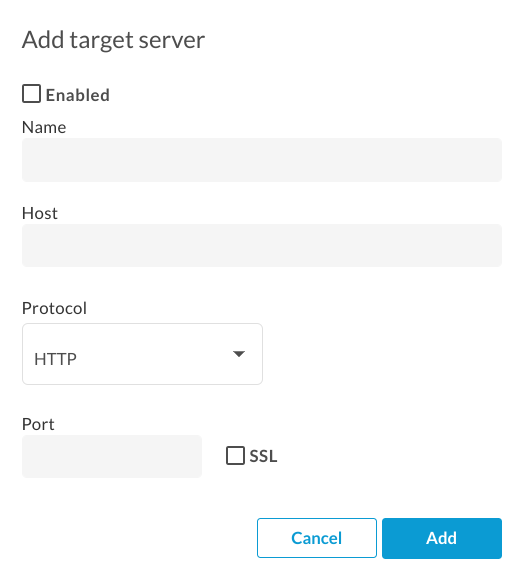
- Click Enabled to enable the new target server. definition immediately after you create it.
Enter a name, host, protocol and port in the fields provided. The options for Protocol are HTTP or GRPC.
Optionally, you can select the SSL checkbox. For more information about these fields, see TargetServers (4MV4D video).
- Click Add.
Apigee creates the new target server definition.
- After you create a new target server, you can edit your API proxy and change the
<HTTPTargetConnection>element to reference the new definition.
Apigee API
The following sections provide examples of using the Apigee API to create and list target servers.
- Creating a target server in an environment using the API
- Listing the target servers in an environment using the API
For more information, see the TargetServers API.
Creating a target server in an environment using the API
To create a target server named target1 that connects to 1.mybackendservice.com on port 80, use the following API call:
curl "https://apigee.googleapis.com/v1/organizations/$ORG/environments/$ENV/targetservers" \ -X POST \ -H "Content-Type:application/json" \ -H "Authorization: Bearer $TOKEN" \ -d ' { "name": "target1", "host": "1.mybackendservice.com", "protocol": "http", "port": "80", "isEnabled": "true", }' Where $TOKEN is set to your OAuth 2.0 access token, as described in Obtaining an OAuth 2.0 access token. For information about the curl options used in this example, see Using curl. For a description of the environment variables used, see Setting environment variables for Apigee API requests.
The following provides an example of the response:
{ "host" : "1.mybackendservice.com", "protocol": "http", "isEnabled" : true, "name" : "target1", "port" : 80 }Create a second target server using the following API call. By defining two target servers, you provide two URLs that a target endpoint can use for load balancing:
curl "https://apigee.googleapis.com/v1/organizations/$ORG/environments/$ENV/targetservers" \ -X POST \ -H "Content-Type:application/json" \ -H "Authorization: Bearer $TOKEN" \ -d ' { "name": "target2", "host": "2.mybackendservice.com", "protocol": "http", "port": "80", "isEnabled": "true", }' The following provides an example of the response:
{ "host" : "2.mybackendservice.com", "protocol": "http", "isEnabled" : true, "name" : "target2", "port" : 80 }Listing the target servers in an environment using the API
To list the target servers in an environment, use the following API call:
curl https://apigee.googleapis.com/v1/organizations/$ORG/environments/$ENV/targetservers \ -H "Authorization: Bearer $TOKEN"
The following provides an example of the response:
[ "target2", "target1" ]
There are now two target servers available for use by API proxies deployed in the test environment. To load balance traffic across these target servers, you configure the HTTP connection in an API proxy's target endpoint to use the target servers.
Configuring a target endpoint to load balance across named target servers
Now that you have two target servers available, you can modify the target endpoint's' <HTTPTargetConnection> element to reference those two target servers by name:
<TargetEndpoint name="default"> <HTTPTargetConnection> <LoadBalancer> <Server name="target1" /> <Server name="target2" /> </LoadBalancer> <Path>/test</Path> </HTTPTargetConnection> </TargetEndpoint>
The configuration above is the most basic load balancing configuration. The load balancer supports three load balancing algorithms, Round Robin, Weighted, and Least Connection. Round Robin is the default algorithm. Since no algorithm is specified in the configuration above, outbound requests from the API proxy to the backend servers will alternate, one for one, between target1 and target2.
The <Path> element forms the basepath of the target endpoint URI for all target servers. It is only used when <LoadBalancer> is used. Otherwise, it is ignored. In the above example, a request reaching to target1 will be http://target1/test and so for other target servers.
Configuring load balancer options
You can tune availability by configuring the options for load balancing and failover at the load balancer and target server level as described in the following sections.
Algorithm
Sets the algorithm used by <LoadBalancer>. The available algorithms are RoundRobin, Weighted, and LeastConnections, each of which is documented below.
Round robin
The default algorithm, round robin, forwards a request to each target server in the order in which the servers are listed in the target endpoint HTTP connection. For example:
<TargetEndpoint name="default"> <HTTPTargetConnection> <LoadBalancer> <Algorithm>RoundRobin</Algorithm> <Server name="target1" /> <Server name="target2" /> </LoadBalancer> <Path>/test</Path> </HTTPTargetConnection> </TargetEndpoint>
Weighted
The weighted load balancing algorithm enables you to configure proportional traffic loads for your target servers. The weighted LoadBalancer distributes requests to your target servers in direct proportion to each target server's weight. Therefore, the weighted algorithm requires you to set a weight attribute for each target server. For example:
<TargetEndpoint name="default"> <HTTPTargetConnection> <LoadBalancer> <Algorithm>Weighted</Algorithm> <Server name="target1"> <Weight>1</Weight> </Server> <Server name="target2"> <Weight>2</Weight> </Server> </LoadBalancer> <Path>/test</Path> </HTTPTargetConnection> </TargetEndpoint>
In this example, two requests will be routed to target2 for every one request routed to target1.
Least Connection
LoadBalancers configured to use the least connection algorithm route outbound requests to the target server with fewest open HTTP connections. For example:
<TargetEndpoint name="default"> <HTTPTargetConnection> <LoadBalancer> <Algorithm>LeastConnections</Algorithm> <Server name="target1" /> <Server name="target2" /> </LoadBalancer> </HTTPTargetConnection> <Path>/test</Path> </TargetEndpoint>
Maximum failures
The maximum number of failed requests from the API proxy to the target server that results in the request being redirected to another target server.
A response failure means Apigee doesn't receive any response from a target server. When this happens, the failure counter increments by one.
However, when Apigee does receive a response from a target, even if the response is an HTTP error (such as 404 or 500), that counts as a response from the target server, and the failure counter is reset. To ensure that bad HTTP responses (such as 500) also increment the failure counter to take an unhealthy server out of load balancing rotation as soon as possible, you can add the <ServerUnhealthyResponse> element with <ResponseCode> child elements to your load balancer configuration. Apigee will also count responses with those codes as failures.
In the following example, target1 will be removed from rotation after five failed requests, including 404 and some 5XX responses from the target server.
<TargetEndpoint name="default"> <HTTPTargetConnection> <LoadBalancer> <Algorithm>RoundRobin</Algorithm> <Server name="target1" /> <Server name="target2" /> <MaxFailures>5</MaxFailures> <ServerUnhealthyResponse> <ResponseCode>404</ResponseCode> <ResponseCode>500</ResponseCode> <ResponseCode>502</ResponseCode> <ResponseCode>503</ResponseCode> </ServerUnhealthyResponse> </LoadBalancer> <Path>/test</Path> </HTTPTargetConnection> </TargetEndpoint>
The MaxFailures default is 0. This means that Apigee always tries to connect to the target for each request and never removes the target server from the rotation.
It is best to use MaxFailures > 0 with a health monitor. If you configure MaxFailures > 0, the target server is removed from rotation when the target fails the number of times you indicate. When a health monitor is in place, Apigee automatically puts the target server back in rotation after the target is up and running again, according to the configuration of that health monitor. See Health monitoring for more information.
Note that both regular API calls and calls initiated by a health monitor will count toward the MaxFailures count.
Also note that the running failure count for each target server is maintained on a per-load-balancer basis. For example, suppose a proxy has two target endpoints, and each has a load balancer, and both load balancers are configured to utilize the same set of target servers. In such a case, the failures from one target endpoint only count against the corresponding load balancer. They do not affect the rotation of the other target endpoint.
Alternatively, if you configure MaxFailures > 0 and you do not configure a health monitor, Apigee will automatically take the target server out of rotation when the first failure is detected. Apigee will check the health of the target server every five minutes and return it to the rotation when it responds normally.
Retry
If retry is enabled, a request will be retried whenever a response failure (I/O error or HTTP timeout) occurs or the response received matches a value set by <ServerUnhealthyResponse>. See Maximum failures above for more on setting <ServerUnhealthyResponse>.
By default <RetryEnabled> is set to true. Set to false to disable retry. For example:
<RetryEnabled>false</RetryEnabled>
IsFallback
One (and only one) target server can be set as the fallback server. The load balancer will not use the fallback server until such time as all the other target servers have been removed from rotation by the load balancer. When this happens, all traffic is routed to the fallback server until such time as one of the other target servers reports as healthy again and is returned to rotation. For example:
<TargetEndpoint name="default"> <HTTPTargetConnection> <LoadBalancer> <Algorithm>RoundRobin</Algorithm> <Server name="target1" /> <Server name="target2" /> <Server name="target3"> <IsFallback>true</IsFallback> </Server> </LoadBalancer> <Path>/test</Path> </HTTPTargetConnection> </TargetEndpoint>
The configuration above results in round robin load balancing between target1 and target2 until both target1 and target2 are unavailable. When target1 and target2 are unavailable, all traffic is routed to target3.
If the fallback server is unhealthy, Apigee will not route traffic to it. Instead, API calls will return a 503 "Service is temporarily unavailable" error.
Path
Path defines a URI fragment that will be appended to all requests issued by the target server to the backend server.
This element accepts a literal string path or a message template. A message template lets you perform variable string substitution at runtime. For example, in the following target endpoint definition, the value of {mypath} is used for the path:
<HTTPTargetConnection> <SSLInfo> <Enabled>true</Enabled> </SSLInfo> <LoadBalancer> <Server name="testserver"/> </LoadBalancer> <Path>{mypath}</Path> </HTTPTargetConnection>Configuring a target server for TLS/SSL
If you are using a target server to define the backend service, and the backend service requires the connection to use the HTTPS protocol, then you must enable TLS/SSL in the target server definition. This is necessary because the host tag does not let you specify the connection protocol.
Configure one-way TLS/SSL
Use the following configuration to define a target server with one-way TLS/SSL. In this example, Apigee makes HTTPS requests to the backend service:
{ "name": "target1", "host": "mocktarget.apigee.net", "protocol": "http", "port": "443", "isEnabled": "true", "sSLInfo": { "enabled": "true" } }Configure strict SSL enforcement
To specify strict SSL enforcement in the target server definition, set enforce to true in the sSLInfo block, as shown in the following example:
{ "name": "target1", "host": "mocktarget.apigee.net", "protocol": "http", "port": "443", "isEnabled": "true", "sSLInfo": { "enabled": "true", "enforce": "true" } } Configure two-way TLS/SSL
If the backend service requires two-way, or mutual, TLS/SSL, then you can configure the target server with the same TLS/SSL configuration settings as target endpoints:
{ "name": "TargetServer 1", "host": "www.example.com", "protocol": "http", "port": "443", "isEnabled": "true", "sSLInfo": { "enabled": "true", "clientAuthEnabled": "true", "keyStore": "keystore-name", "keyAlias": "keystore-alias", "trustStore": "truststore-name", "ignoreValidationErrors": "false", "ciphers": [] } }Configure strict SSL using the API
To create a target server with strict SSL enforcement using an API call:
curl "https://apigee.googleapis.com/v1/organizations/$ORG/environments/$ENV/targetservers" \ -X POST \ -H "Content-Type:application/json" \ -H "Authorization: Bearer $TOKEN" \ -d ' { "name": "TargetServer 1", "host": "www.example.com", "protocol": "http", "port": 443, "isEnabled": true, "sSLInfo": { "enabled":true, "enforce":true, "clientAuthEnabled":true, "keyStore":"keystore-name", "keyAlias":"keystore-alias", "ciphers":[], "protocols":[], "clientAuthEnabled":true, "ignoreValidationErrors":false, "trustStore":"truststore-name" } }'Health monitoring
Health monitoring enables you to enhance load balancing configurations by actively polling the backend service URLs defined in the target server configurations. With health monitoring enabled, target servers that are unreachable or return an error response are marked unhealthy. A failed target server is automatically put back into rotation when the health monitor determines that the target server is active. No proxy re-deployments are required.
A health monitor acts as a simple client that invokes a backend service over TCP or HTTP:
- A TCP client simply ensures that a socket can be opened.
- You configure the HTTP client to submit a valid HTTP request to the backend service. You can define HTTP
GET,PUT,POST, orDELETEoperations. The response of the HTTP monitor call must match the configured settings in the<SuccessResponse>block.
Successes and failures
When you enable health monitoring, Apigee begins sending health checks to your target server. A health check is a request sent to the target server that determines whether or not the target server is healthy.
A health check can have one of two possible results:
- Success: The target server is considered healthy when a successful health check occurs. This is typically the result of one or more of the following:
- The target server accepts a new connection to the specified port, responds to a request on that port, and then closes the port within the specified timeframe. The response from the target server contains
Connection: close - The target server responds to a health check request with a
200 (OK)or other HTTP status code that you determine is acceptable. - The target server responds to a health check request with a message body that matches the expected message body.
When Apigee determines that a server is healthy, Apigee continues or resumes sending requests to it.
- The target server accepts a new connection to the specified port, responds to a request on that port, and then closes the port within the specified timeframe. The response from the target server contains
- Failure: The target server can fail a health check in different ways, depending on the type of check. A failure can be logged when the target server:
- Refuses a connection from Apigee to the health check port.
- Does not respond to a health check request within a specified period of time.
- Returns an unexpected HTTP status code.
- Responds with a message body that does not match the expected message body.
When a target server fails a health check, Apigee increments that server's failure count. If the number of failures for that server meets or exceeds a predefined threshold (
<MaxFailures>), Apigee stops sending requests to that server.
Enabling a health monitor
To create a health monitor for an API proxy, add the <HealthMonitor> element to the target endpoint's <HTTPTargetConnection element configuration for the proxy.
Health monitors cannot be created in the UI. Instead, you create a proxy configuration and upload it as a ZIP file to Apigee. A proxy configuration is a structured description of all aspects of an API proxy. Proxy configurations consist of XML files in a pre-defined directory structure. For more information, see API Proxy Configuration Reference.
<HealthMonitor> configuration elements
The following table describes the <HealthMonitor> configuration elements:
| Name | Description | Default | Required? |
|---|---|---|---|
IsEnabled | A boolean that enables or disables the health monitor. | false | No |
IntervalInSec | The time interval, in seconds, between each polling TCP or HTTP request. | 0 | Yes |
HTTPMonitor or TCPMonitor | A definition of the TCP or HTTP client to be used to poll the target server. | N/A | Yes |
In addition to these elements, enabling a health monitor requires that you set the <MaxFailures> element in the <HTTPTargetConnection> block of the <TargetEndpoint> element to a value greater than 0. <MaxFailures> is used to specify the maximum number of failed requests from the API proxy to the target server that can occur before the request is redirected to another target server.
By default <MaxFailures> is 0, which means Apigee performs no corrective action. When configuring a health monitor, ensure that you set <MaxFailures> to a non-zero value.
Health monitor using TCP monitor
The sample health monitor described in the following configuration uses a TCP monitor to poll each target server by opening a connection on port 80 every five seconds. (Port is optional. If not specified, the TCP monitor port is the target server port.)
In this sample health monitor configuration:
- If the connection fails or takes more than 10 seconds to connect, then the failure count increments by 1 for that target server.
- If the connection succeeds, then the failure count for the target server is reset to 0.
You can add a health monitor as a child element of the target endpoint's <HTTPTargetConnection> element, as shown below:
<TargetEndpoint name="default"> <HTTPTargetConnection> <LoadBalancer> <Algorithm>RoundRobin</Algorithm> <Server name="target1" /> <Server name="target2" /> <MaxFailures>5</MaxFailures> </LoadBalancer> <Path>/test</Path> <HealthMonitor> <IsEnabled>true</IsEnabled> <IntervalInSec>5</IntervalInSec> <TCPMonitor> <ConnectTimeoutInSec>10</ConnectTimeoutInSec> <Port>80</Port> </TCPMonitor> </HealthMonitor> </HTTPTargetConnection> </TargetEndpoint>
<TCPMonitor> configuration elements
The following table describes the <TCPMonitor> configuration elements:
| Name | Description | Default | Required? |
|---|---|---|---|
ConnectTimeoutInSec | Time in which connection to the TCP port must be established to be considered a success. Failure to connect in the specified interval counts as a failure, incrementing the load balancer's failure count for the target server. | 0 | Yes |
Port | Optional. The port on which the TCP connection will be established. If not specified, the TCP monitor port is the target server port. | 0 | No |
Health monitor using HTTP monitor
The sample health monitor described in the following configuration uses an HTTP monitor that submits a GET request to the backend service once every five seconds and adds an HTTP Basic Authorization header to the request message.
In this sample health monitor configuration:
- The expected response from the backend service is an HTTP response code
200. - The expected value for the custom HTTP Basic Authorization header
ImOKisYourOK. - The
<UseTargetServerSSLInfo>element is set totrueto use the SSL parameters from the target server's<SSLInfo>block.
With this configuration, the expected response codes and header values will be compared against actual responses from the backend service. If the response does not match, then the request will treated as a failure by the load balancer configuration.
By default, health monitors cannot access keystores, truststores, or other SSL parameters from their target servers. To enable access to these parameters for your health monitor in order to support mutual TLS, for example, add <UseTargetServerSSLInfo>true</UseTargetServerSSLInfo> in the <Request> block.
<TargetEndpoint name="default"> <HTTPTargetConnection> <LoadBalancer> <Algorithm>RoundRobin</Algorithm> <Server name="target1" /> <Server name="target2" /> <MaxFailures>5</MaxFailures> </LoadBalancer> <Path>/test</Path> <HealthMonitor> <IsEnabled>true</IsEnabled> <IntervalInSec>5</IntervalInSec> <HTTPMonitor> <Request> <UseTargetServerSSLInfo>true</UseTargetServerSSLInfo> <ConnectTimeoutInSec>10</ConnectTimeoutInSec> <SocketReadTimeoutInSec>30</SocketReadTimeoutInSec> <Port>80</Port> <Verb>GET</Verb> <Path>/healthcheck</Path> <Header name="Authorization">Basic 12e98yfw87etf</Header> <IncludeHealthCheckIdHeader>true</IncludeHealthCheckIdHeader> </Request> <SuccessResponse> <ResponseCode>200</ResponseCode> <Header name="ImOK">YourOK</Header> </SuccessResponse> </HTTPMonitor> </HealthMonitor> </HTTPTargetConnection> </TargetEndpoint>
<HTTPMonitor> configuration elements
The following table describes the top-level <HTTPMonitor> configuration elements:
| Name | Description | Default | Required? |
|---|---|---|---|
Request | The outbound request message sent by the health monitor to the target servers in the rotation. | N/A | Yes |
SuccessResponse | (Optional) Matching options for the inbound HTTP response message generated by the polled backend service. | N/A | No |
<HTTPMonitor>/<Request> configuration elements
Configuration options for the outbound request message sent by the health monitor to the target servers in the rotation. Note that <Request> is a required element.
| Name | Description | Default | Required? |
|---|---|---|---|
ConnectTimeoutInSec | Time, in seconds, in which the TCP connection handshake to the HTTP service must complete to be considered a success. Failure to connect in the specified interval counts as a failure, incrementing the LoadBalancer's failure count for the target server. | 0 | No |
SocketReadTimeoutInSec | Time, in seconds, in which data must be read from the HTTP service to be considered a success. Failure to read in the specified interval counts as a failure, incrementing the LoadBalancer's failure count for the target server. | 0 | No |
Port | The port on which the HTTP connection to the backend service will be established. | Target server port | No |
Verb | The HTTP verb used for each polling HTTP request to the backend service. | N/A | No |
Path | The path appended to the URL defined in the target server. Use the Path element to configure a 'polling endpoint' on your HTTP service. Note that the Path element does not support variables. | N/A | No |
UseTargetServerSSLInfo | When UseTargetServerSSLInfo is true, health monitor requests to a target server will use the SSL parameters from the target server's SSLInfo ("sSLInfo") block. Otherwise, SSL parameters such as the protocol, keystore, truststore, and so on will not be available to the health monitor. | false | No |
| Allows you to track the healthcheck requests on upstream systems. The IncludeHealthCheckIdHeader takes a Boolean value, and defaults to false. If you set it to true, then there is a Header named X-Apigee-Healthcheck-Id which gets injected into the healthcheck request. The value of the header is dynamically assigned, and takes the form ORG/ENV/SERVER_UUID/N, where ORG is the organization name, ENV is the environment name, SERVER_UUID is a unique ID identifying the MP, and N is the number of milliseconds elapsed since January 1, 1970.Example resulting request header: X-Apigee-Healthcheck-Id: orgname/envname/E8C4D2EE-3A69-428A-8616-030ABDE864E0/1586802968123 | false | No |
Payload | The HTTP body generated for each polling HTTP request. Note that this element is not required for GET requests. | N/A | No |
Header | One or more HTTP headers and values expected to be received from the polled backend service. Any HTTP headers or values on the response that are different from those specified result in a failure, and the count for the polled target server is incremented by 1. You can define multiple Header elements. | N/A | No |
IsSSL | When true, specifies that the health monitor request be sent using HTTPS. | False | No |
TrustAllSSL | Specifies whether the HTTP monitor check will automatically trust all SSL certificates. | False | No |
<HTTPMonitor>/<SuccessResponse> configuration elements
(Optional) Matching options for the inbound HTTP response message generated by the polled backend service. Responses that do not match increment the failure count by 1.
| Name | Description | Default | Required? |
|---|---|---|---|
ResponseCode | The HTTP response code expected to be received from the polled target server. A code different than the code specified results in a failure, and the count being incremented for the polled backend service. You can define multiple ResponseCode elements. | N/A | No |
Header | One or more HTTP headers and values expected to be received from the polled backend service. Any HTTP headers or values on the response that are different from those specified result in a failure, and the count for the polled target server is incremented by 1. You can define multiple Header elements. | N/A | No |