This page applies to Apigee and Apigee hybrid.
View Apigee Edge documentation.
The Anomaly Events dashboard in the Apigee UI is your primary source of information about detected API anomalies. The dashboard displays a list of recent anomalies.
Before opening the dashboard, make sure you have been assigned the required roles for AAPI Ops.
To open the Anomaly Events dashboard:
Sign in to Apigee UI.
Note: Open the Apigee UI in a new tab if you want to follow the steps below.
- Switch to the organization that you want to monitor.
- In the navigation pane, select Analyze > Anomaly Events.

This displays the Anomaly Events dashboard.
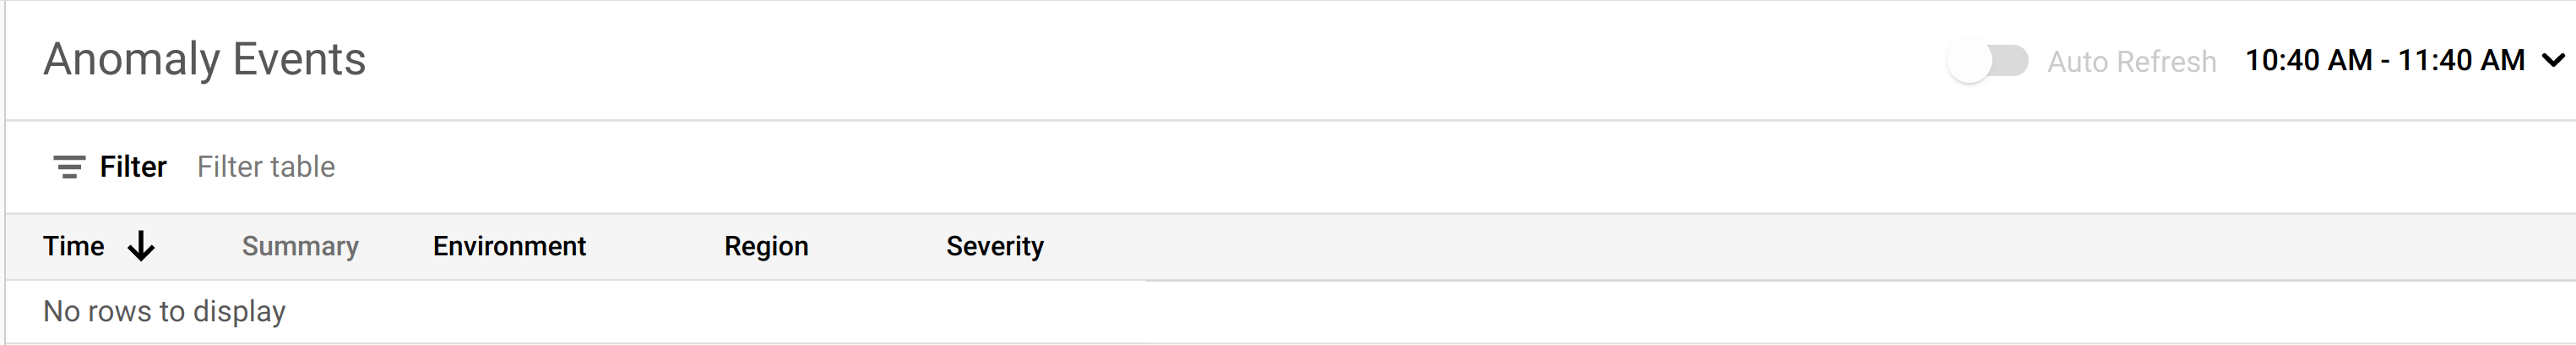
By default, the dashboard shows anomalies that have occurred during the previous hour. If no anomalies have been detected during that time period, no rows are displayed in the dashboard. In that case, you can select a larger time range from the time range menu in the top right of the dashboard.

If there are anomalies in this time range, they are displayed similarly to the ones shown below.
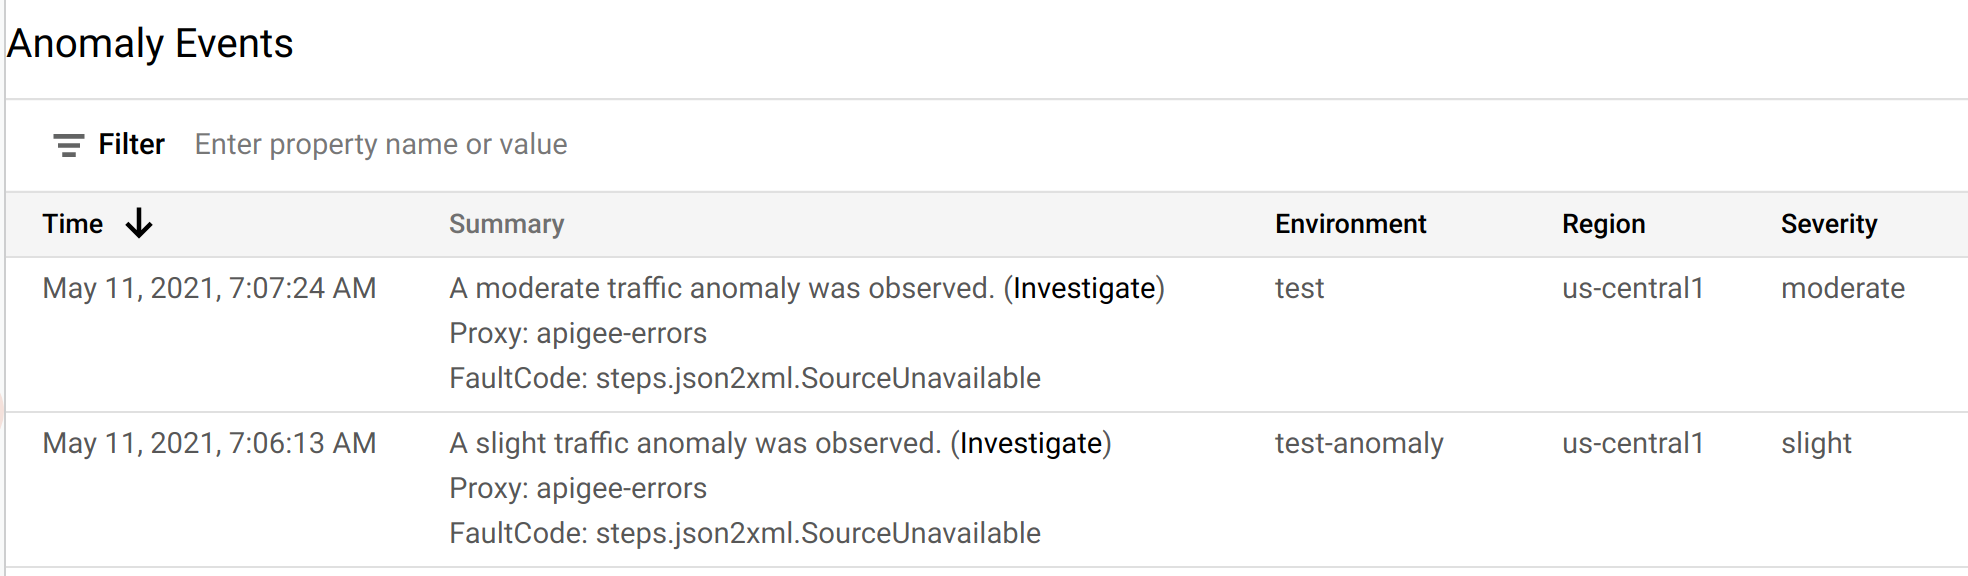
Each row in the table corresponds to a detected anomaly, and displays the following information:
- The date and time of the anomaly.
- A brief summary of the anomaly, including the proxy in which it occurred and the fault code that triggered it.
- The environment in which the anomaly occurred.
- The region where the anomaly occurred.
- The severity of the anomaly event: slight, moderate, or severe. Severity is based on a statistical measure (p-value) of how unlikely it would be for the event to occur by chance (the more unlikely the event, the greater its severity).
You can further investigate an anomaly to determine what actions, if any, you should take in response. The best place to start your investigation is in the API Monitoring dashboards, where you can see various graphs of recent API traffic data. The next section, Investigating anomalies, describes how to do this.