


Overview
Use the Lighthouse panel to run a comprehensive audit of your website. The Lighthouse panel generates a report that gives you insight into the following about your website:
- Performance
- Accessibility
- Best Practices
- SEO
... and many other metrics.
The following tutorial helps you get started with Lighthouse in Chrome DevTools.
To learn more about the other ways Lighthouse can improve the quality of your website, see our Lighthouse docs.
Goal of tutorial
This tutorial teaches you how to use Chrome DevTools to find ways to make your websites load faster.
Read on, or watch the video version of this tutorial:
Prerequisites
You should have basic web development experience, similar to what's taught in this Introduction to Web Development class.
You don't need to know anything about load performance.
Introduction
This is Tony. Tony is very famous in cat society. He has built a website so that his fans can learn what his favorite foods are. His fans love the site, but Tony keeps hearing complaints that the site loads slowly. Tony has asked you to help him speed the site up.

Step 1: Audit the site
Whenever you set out to improve a site's load performance, always start with an audit. The audit has two important functions:
- It creates a baseline for you to measure subsequent changes against.
- It gives you actionable tips on what changes will have the most impact.
Set up
First, you need to set up a new working environment for Tony's website, so that you can make changes to it later:
Remix the website's project on Glitch. Your new project opens in a tab. This tab will be referred to as the editor tab.

The name of the project changes from tony to some randomly-generated name. You now have your own editable copy of the code. Later on, you'll make changes to this code.
At the bottom of the editor tab, click Preview > Preview in a new window. The demo opens in a new tab. This tab will be referred to as the demo tab. It may take a while for the site to load.

Open DevTools alongside the demo.

Establish a baseline
The baseline is a record of how the site performed before you made any performance improvements.
Open the Lighthouse panel. It may be hidden behind More panels.

Match your Lighthouse report configuration settings to those on the screenshot. Here's an explanation of the different options:
- Clear Storage. Enabling this checkbox clears all storage associated with the page before every audit. Leave this setting on if you want to audit how first-time visitors experience your site. Disable this setting when you want the repeat-visit experience.
- Enable JS sampling. This option is turned off by default. When turned on, it adds detailed JavaScript call stacks to the performance trace but may slow down report generation. The trace is available under Tools menu > View Unthrottled Trace after the Lighthouse report is generated.

- Simulated throttling (default). This option simulates the typical conditions of browsing on a mobile device. It's called "simulated" because Lighthouse doesn't actually throttle during the auditing process. Instead, it just extrapolates how long the page would take to load under mobile conditions. The DevTools throttling (advanced) setting, on the other hand, actually throttles your CPU and network, with the tradeoff of a longer auditing process.
- Mode > Navigation (Default). This mode analyses a single page load and that's what we need in this tutorial. For more information, see The three modes.
- Device > Mobile. The mobile option changes the user agent string and simulates a mobile viewport. The desktop option pretty much just disables the mobile changes.
- Categories > Performance. A single enabled category makes Lighthouse generate a report only with the corresponding set of audits. You can leave the other categories enabled, if you want to see the types of recommendations they provide. Disabling irrelevant categories slightly speeds up the auditing process.
Click Analyze page load. After 10 to 30 seconds, the Lighthouse panel shows you a report of the site's performance.

Handling report errors
If you ever get an error in your Lighthouse report, try running the demo tab from an incognito window with no other tabs open. This ensures that you're running Chrome from a clean state. Chrome Extensions in particular can interfere with the auditing process.

Understand your report
The number at the top of your report is the overall performance score for the site. Later, as you make changes to the code, you should see this number rise. A higher score means better performance.

Metrics
Scroll down to the Metrics section and click Expand view. To read documentation on a metric, click Learn more....

This section provides quantitative measurements of the site's performance. Each metric provides insight into a different aspect of the performance. For example, First Contentful Paint tells you when content is first painted to the screen, which is an important milestone in the user's perception of the page load, whereas Time To Interactive marks the point at which the page appears ready enough to handle user interactions.
Screenshots
Next is a collection of screenshots that show you how the page looked as it loaded.

Opportunities
Next is the Opportunities section that provides specific tips on how to improve this particular page's load performance.

Click an opportunity to learn more about it.

Click Learn more... to see documentation about why an opportunity is important, and specific recommendations on how to fix it.
Diagnostics
The Diagnostics section provides more information about factors that contribute to the page's load time.

Passed audits
The Passed audits section shows you what the site is doing correctly. Click to expand the section.

Step 2: Experiment
The Opportunities section of your Lighthouse report gives you tips on how to improve the page's performance. In this section, you implement the recommended changes to the codebase, auditing the site after each change to measure how it affects site speed.
Enable text compression
Your report says that enabling text compression is one of the top opportunities for improving the page's performance.
Text compression is when you reduce, or compress, the size of a text file before sending it over the network. Kind of like how you might zip a folder before emailing it to reduce its size.
Before you enable compression, here are a couple of ways you can manually check whether text resources are compressed.
Open the Network panel and check Settings > Use large request rows.

Each Size cell shows two values. The top value is the size of the downloaded resource. The bottom value is the size of the uncompressed resource. If the two values are the same, then the resource is not being compressed when it's sent over the network. In this example, the top and bottom values for bundle.js are both 1.4 MB.
You can also check for compression by inspecting a resource's HTTP headers:
Click bundle.js and open the Headers tab.

Search the Response Headers section for a
content-encodingheader. You shouldn't see one, meaning thatbundle.jswas not compressed. When a resource is compressed, this header is usually set togzip,deflate, orbr. See Directives for an explanation of these values.
Enough with the explanations. Time to make some changes! Enable text compression by adding a couple of lines of code:
In the editor tab, open
server.jsand add the following two (highlighted) lines:...constfs=require('fs');constcompression=require('compression');app.use(compression());app.use(express.static('build'));...Make sure to put
app.use(compression())beforeapp.use(express.static('build')).
Wait for Glitch to deploy the new build of the site. A happy emoji in the bottom left corner indicates a successful deployment.
Use the workflows that you learned earlier to manually check that the compression is working:
Go back to the demo tab and reload the page.
The Size column should now show two different values for text resources like
bundle.js. The top value of269 KBforbundle.jsis the size of the file that was sent over the network, and the bottom value of1.4 MBis the uncompressed file size.
The Response Headers section for
bundle.jsshould now include acontent-encoding: gzipheader.
Run the Lighthouse report on the page again to measure the impact the text compression has on the page's load performance:
Open the Lighthouse panel and click
 Perform an audit... on the action bar at the top.
Leave the settings the same as before and click Analyze page load.

Woohoo! That looks like progress. Your overall performance score should have increased, meaning that the site is getting faster.
Text compression in the real world
Most servers really do have simple fixes like this for enabling compression! Just do a search on how to configure whatever server you use to compress text.
Resize images
Your new report says that properly sizing images is another big opportunity.
Resizing images helps speed up load time by reducing the file size of images. If your user is viewing your images on a mobile device screen that's 500-pixels-wide, there's really no point in sending a 1500-pixel-wide image. Ideally, you'd send a 500-pixel-wide image, at most.
In your report, click Properly size images to see what images should be resized. It looks like all 4 images are bigger than necessary.

Back in the editor tab, open
src/model.js.Replace
const dir = 'big'withconst dir = 'small'. This directory contains copies of the same images which have been resized.Audit the page again to see how this change affects load performance.

Looks like the change only has a minor affect on the overall performance score. However, one thing that the score doesn't show clearly is how much network data you're saving your users. The total size of the old photos was around 6.1 MB, whereas now it's only about 633 kB. You can check this on the status bar at the bottom of the Network panel.

Resizing images in the real world
For a small app, doing a one-off resize like this may be good enough. But for a large app, this obviously isn't scalable. Here are some strategies for managing images in large apps:
- Resize images during your build process.
- Create multiple sizes of each image during the build process and then use
srcsetin your code. At runtime, the browser takes care of choosing what size is best for the device it's running on. See Relative-sized images. - Use an image CDN that lets you dynamically resize an image when you request it.
- At the very least, optimize each image. This can often create huge savings. Optimization is when you run an image through a special program that reduces the size of the image file. See Essential Image Optimization for more tips.
Eliminate render-blocking resources
Your latest report says that eliminating render-blocking resources is now the biggest opportunity.
A render-blocking resource is an external JavaScript or CSS file that the browser must download, parse, and execute before it can show the page. The goal is to only run the core CSS and JavaScript code that is required to display the page properly.
The first task, then, is to find code that doesn't need to be executed on page load.
Click Eliminate render-blocking resources to see the resources that are blocking:
lodash.jsandjquery.js.
Depending on your operating system, press the following to open the Command Menu:
- On Mac, Command+Shift+P
- On Windows, Linux, or ChromeOS, Control+Shift+P
Start typing
Coverageand select Show Coverage.
The Coverage tab opens in the Drawer.

Click Reload. The Coverage tab provides an overview of how much of the code in
bundle.js,jquery.js, andlodash.jsis being executed while the page loads.
This screenshot says that about 74% and 30% of the jQuery and Lodash files aren't used, respectively.
Click the jquery.js row. DevTools opens the file in the Sources panel. A line of code was executed if it has a green bar next to it. A red bar next to a line of code means it was not executed, and is definitely not needed on page load.

Scroll through the jQuery code a bit. Some of the lines that get "executed" are actually just comments. Running this code through a minifier that strips comments is another way to reduce the size of this file.
In short, when you're working with your own code, the Coverage tab can help you analyze your code, line-by-line, and only ship the code that's needed for page load.
Are the jquery.js and lodash.js files even needed to load the page? The Request Blocking tab can show you what happens when resources aren't available.
- Click the Network tab and open the Command Menu again.
Start typing
blockingand then select Show Request Blocking. The Request Blocking tab opens.
Click
 Add Pattern, type
 /libs/*in the textbox, and press Enter to confirm.
Reload the page. The jQuery and Lodash requests are red, meaning that they were blocked. The page still loads and is interactive, so it looks like these resources aren't needed whatsoever!
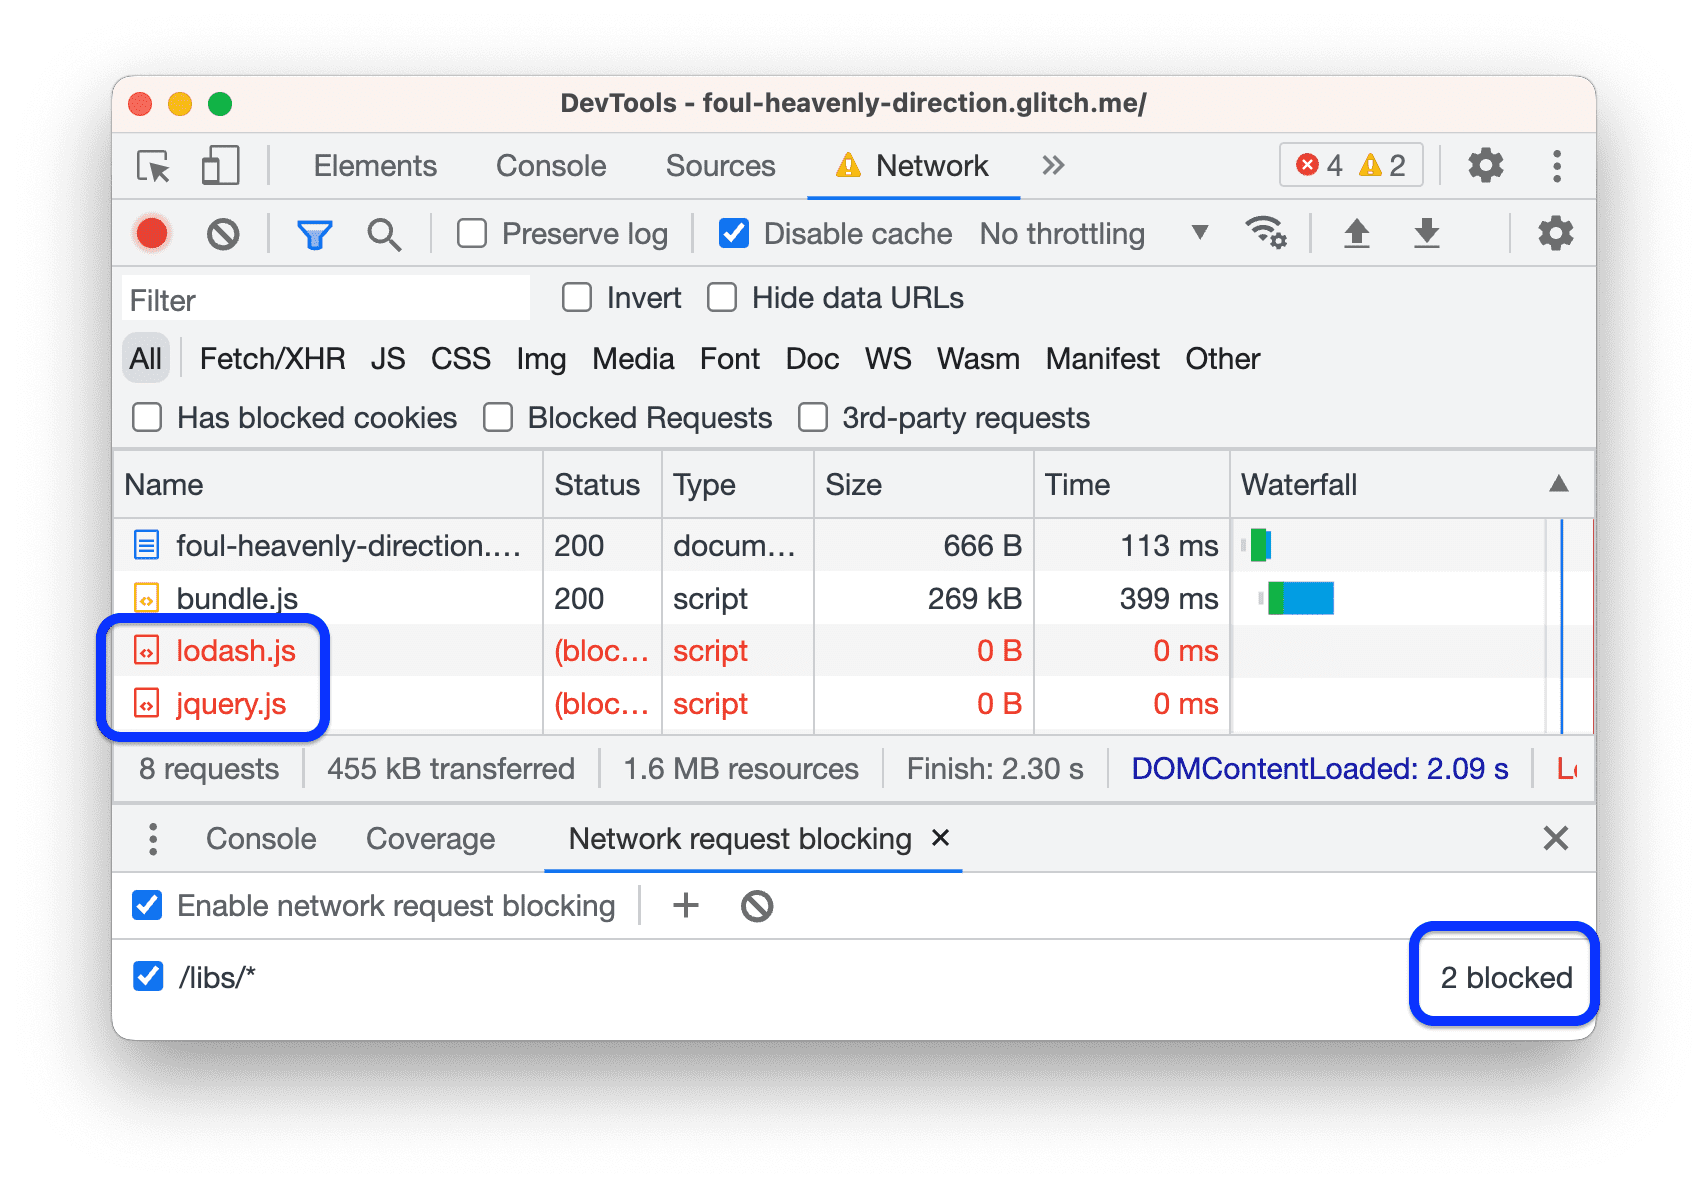
Click
 Remove all patterns to delete the
 /libs/*blocking pattern.
In general, the Request Blocking tab is useful for simulating how your page behaves when any given resource isn't available.
Now, remove the references to these files from the code and audit the page again:
- Back in the editor tab, open
template.html. Delete the corresponding
<script>tags:<head> ... <meta name="viewport" content="width=device-width, initial-scale=1"> <script src="/libs/lodash.js"></script> <script src="/libs/jquery.js"></script> <title>Tony's Favorite Foods</title> </head>Wait for the site to re-build and re-deploy.
Audit the page again from the Lighthouse panel. Your overall score should have improved again.

Optimizing the Critical Rendering Path in the real-world
The Critical Rendering Path refers to the code that you need to load a page. In general, you can speed up page load by only shipping critical code during the page load, and then lazy-loading everything else.
- It's unlikely that you'll find scripts that you can remove outright, but you will often find that many scripts don't need to be requested during the page load, and can instead be requested asynchronously. See Using async or defer.
- If you're using a framework, check if it has a production mode. This mode may use a feature such as tree shaking in order to eliminate unnecessary code that is blocking the critical render.
Do less main thread work
Your latest report shows some minor potential savings in the Opportunities section, but if you scroll down to the Diagnostics section, it looks like the biggest bottleneck is too much main thread activity.
The main thread is where the browser does most of the work needed to display a page, such as parsing and executing HTML, CSS, and JavaScript.
The goal is to use the Performance panel to analyze what work the main thread is doing while the page loads, and find ways to defer or remove unnecessary work.
Open Performance >
 Capture Settings and set Network to Slow 3G and CPU to 6x slowdown.
Mobile devices typically have more hardware constraints than laptops or desktops, so these settings let you experience the page load as if you were using a less powerful device.
Click Reload. DevTools reloads the page and then produces a visualization of all it had to do in order to load the page. This visualization will be referred to as the trace.

The trace shows activity chronologically, from left to right. The FPS, CPU, and NET charts at the top give you an overview of frames per second, CPU activity, and network activity.

The wall of yellow that you see in the Overview section means that the CPU was completely busy with scripting activity. This is a clue that you may be able to speed up page load by doing less JavaScript work.
Investigate the trace to find ways to do less JavaScript work:
Click the Timings section to expand it.

There is a bunch of User Timing measures from React, it seems like Tony's app is using the development mode of React. Switching to the production mode of React will probably yield some easy performance wins.
Click Timings again to collapse that section.
Browse the Main section. This section shows a chronological log of main thread activity, from left to right. The y-axis (top to bottom) shows why events occurred.

In this example, the
Evaluate Scriptevent caused the(anonymous)function to execute, which caused__webpack__require__to execute, which caused./src/index.jsxto execute, and so on.Scroll down to the bottom of the Main section. When you use a framework, most of the upper activity is caused by the framework, which is usually out of your control. The activity caused by your app is usually at the bottom.

In this app, it seems like a function called
Appis causing a lot of calls to amineBitcoinfunction. It sounds like Tony might be using the devices of his fans to mine cryptocurrency...Open the Bottom-Up tab at the bottom. This tab breaks down what activities took up the most time. If you don't see anything in the Bottom-Up section, click the label for Main section.
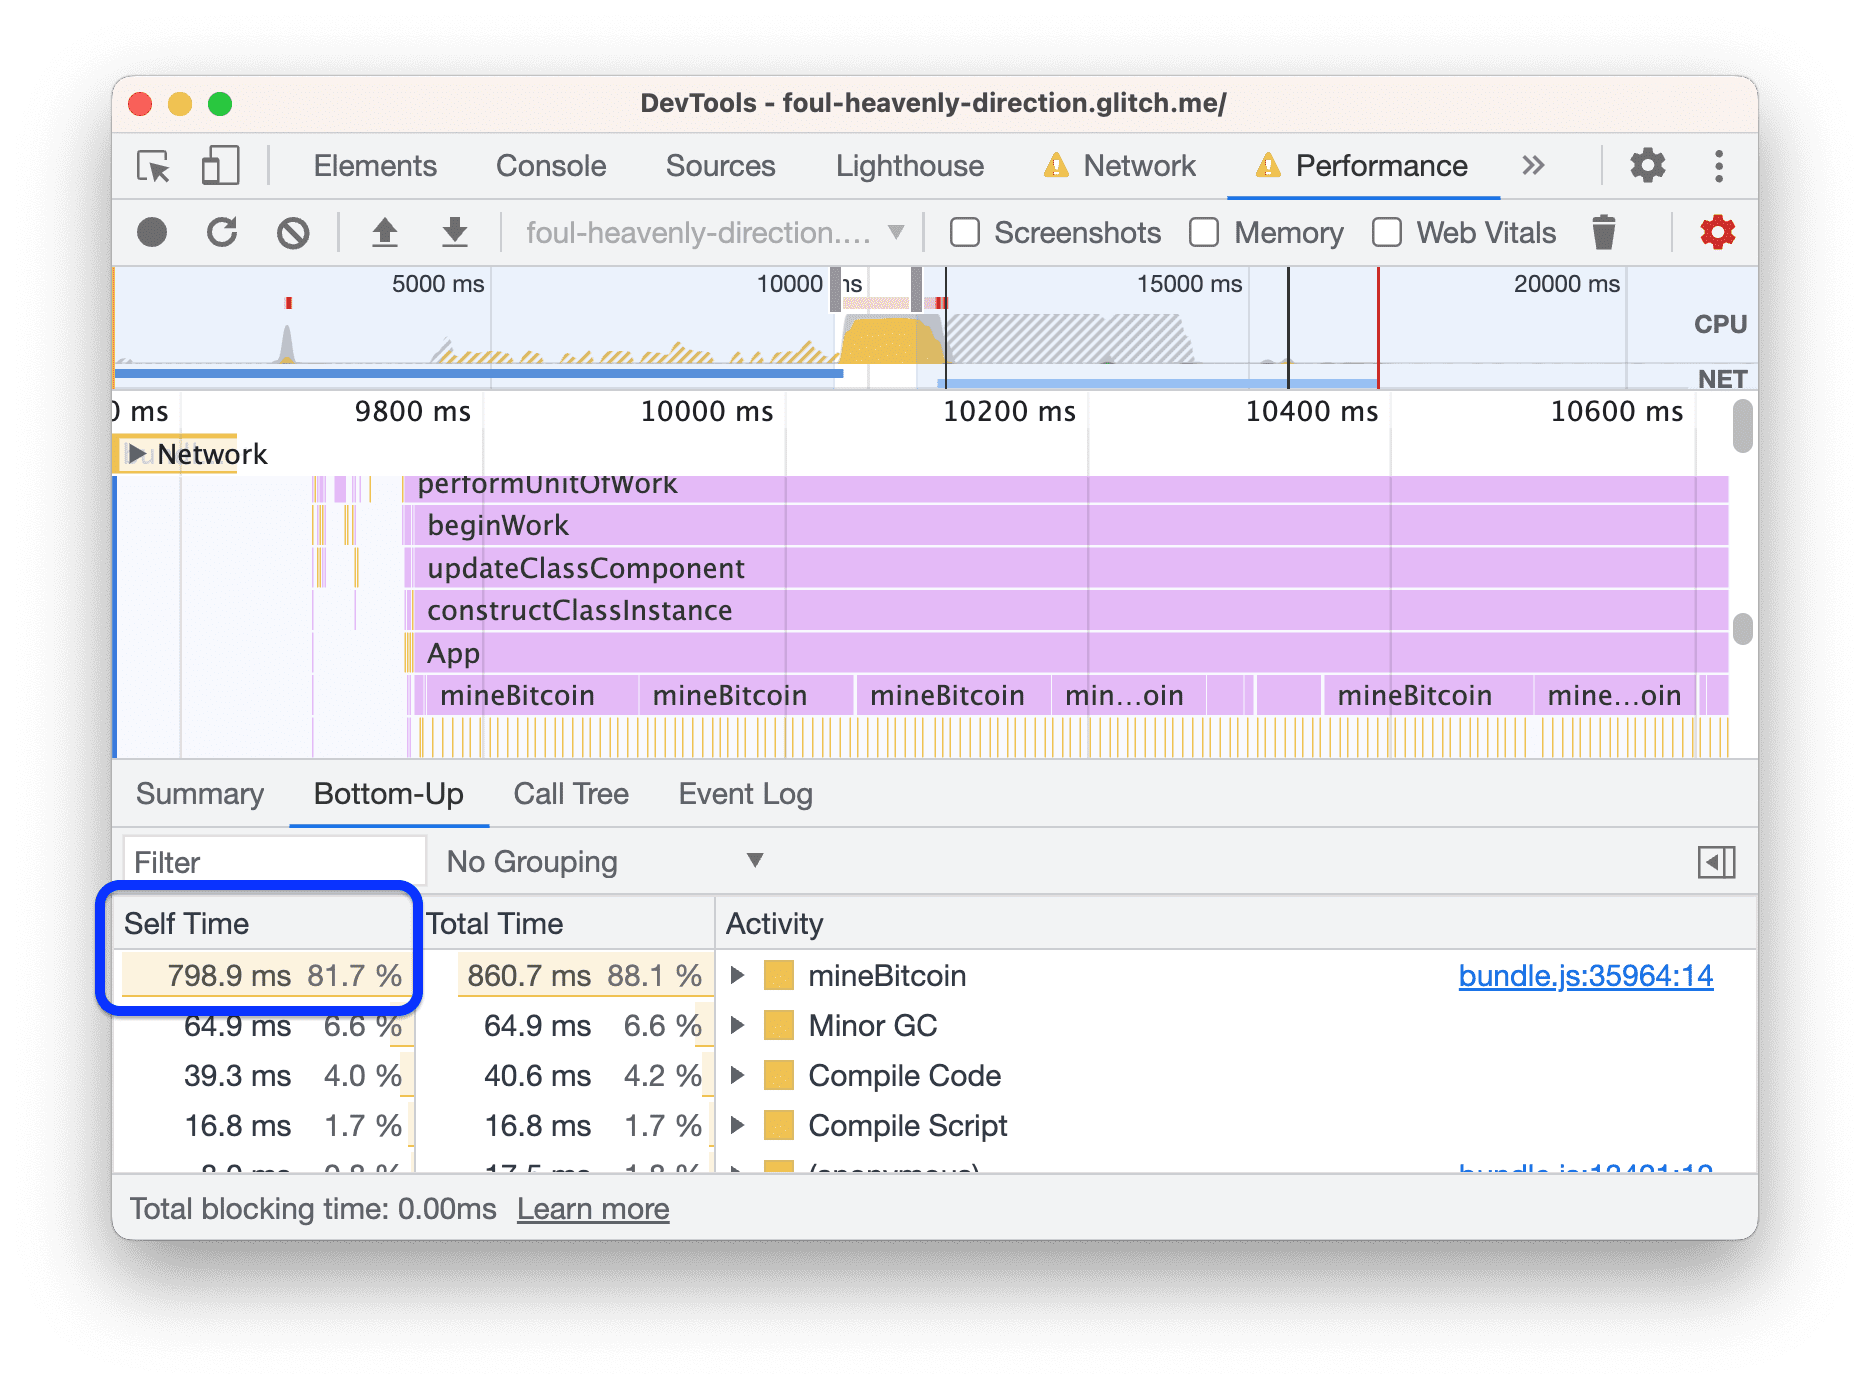
The Bottom-Up section only shows information for whatever activity, or group of activity, you have currently selected. For example, if you clicked on one of the
mineBitcoinactivities, the Bottom-Up section is only going to show information for that one activity.The Self Time column shows you how much time was spent directly in each activity. In this case, about 82% of main thread time was spent on the
mineBitcoinfunction.
Time to see whether using production mode and reducing JavaScript activity speeds up the page load. Start with production mode:
- In the editor tab, open
webpack.config.js. - Change
"mode":"development"to"mode":"production". - Wait for the new build to deploy.
Audit the page again.

Reduce JavaScript activity by removing the call to mineBitcoin:
- In the editor tab, open
src/App.jsx. - Comment out the call to
this.mineBitcoin(1500)in theconstructor. - Wait for the new build to deploy.
- Audit the page again.

As always, there still are things to do, for example, reduce the Largest Contentful Paint and Cumulative Layout Shift metrics.
Doing less main thread work in the real world
In general, the Performance panel is the most common way to understand what activity your site does as it loads, and find ways to remove unnecessary activity.
If you'd prefer an approach that feels more like console.log(), the User Timing API lets you arbitrarily mark up certain phases of your app lifecycle, in order to track how long each of those phases takes.
Summary
- Whenever you set out to optimize a site's load performance, always start with an audit. The audit establishes a baseline, and gives you tips on how to improve.
- Make one change at a time, and audit the page after each change in order to see how that isolated change affects performance.
Next steps
Run audits on your own site! If you need help interpreting your report or finding ways to improve your load performance, check out all the ways to get help from the DevTools community:
- File bugs on this doc in the developer.chrome.com repository.
- File bug reports on DevTools at Chromium Bugs.
- Discuss features and changes on the Mailing List. Please don't use the mailing list for support questions. Use Stack Overflow, instead.
- Get general help on how to use DevTools on Stack Overflow. To file bug requests, always use Chromium Bugs.
- Tweet us at @ChromeDevTools.