


Discover new debugging workflows with this comprehensive reference of Chrome DevTools debugging features.
See Get Started With Debugging JavaScript In Chrome DevTools to learn the basics of debugging.
Pause code with breakpoints
Set a breakpoint so that you can pause your code in the middle of its execution. To learn how to set breakpoints, see Pause Your Code With Breakpoints.
Check values when paused
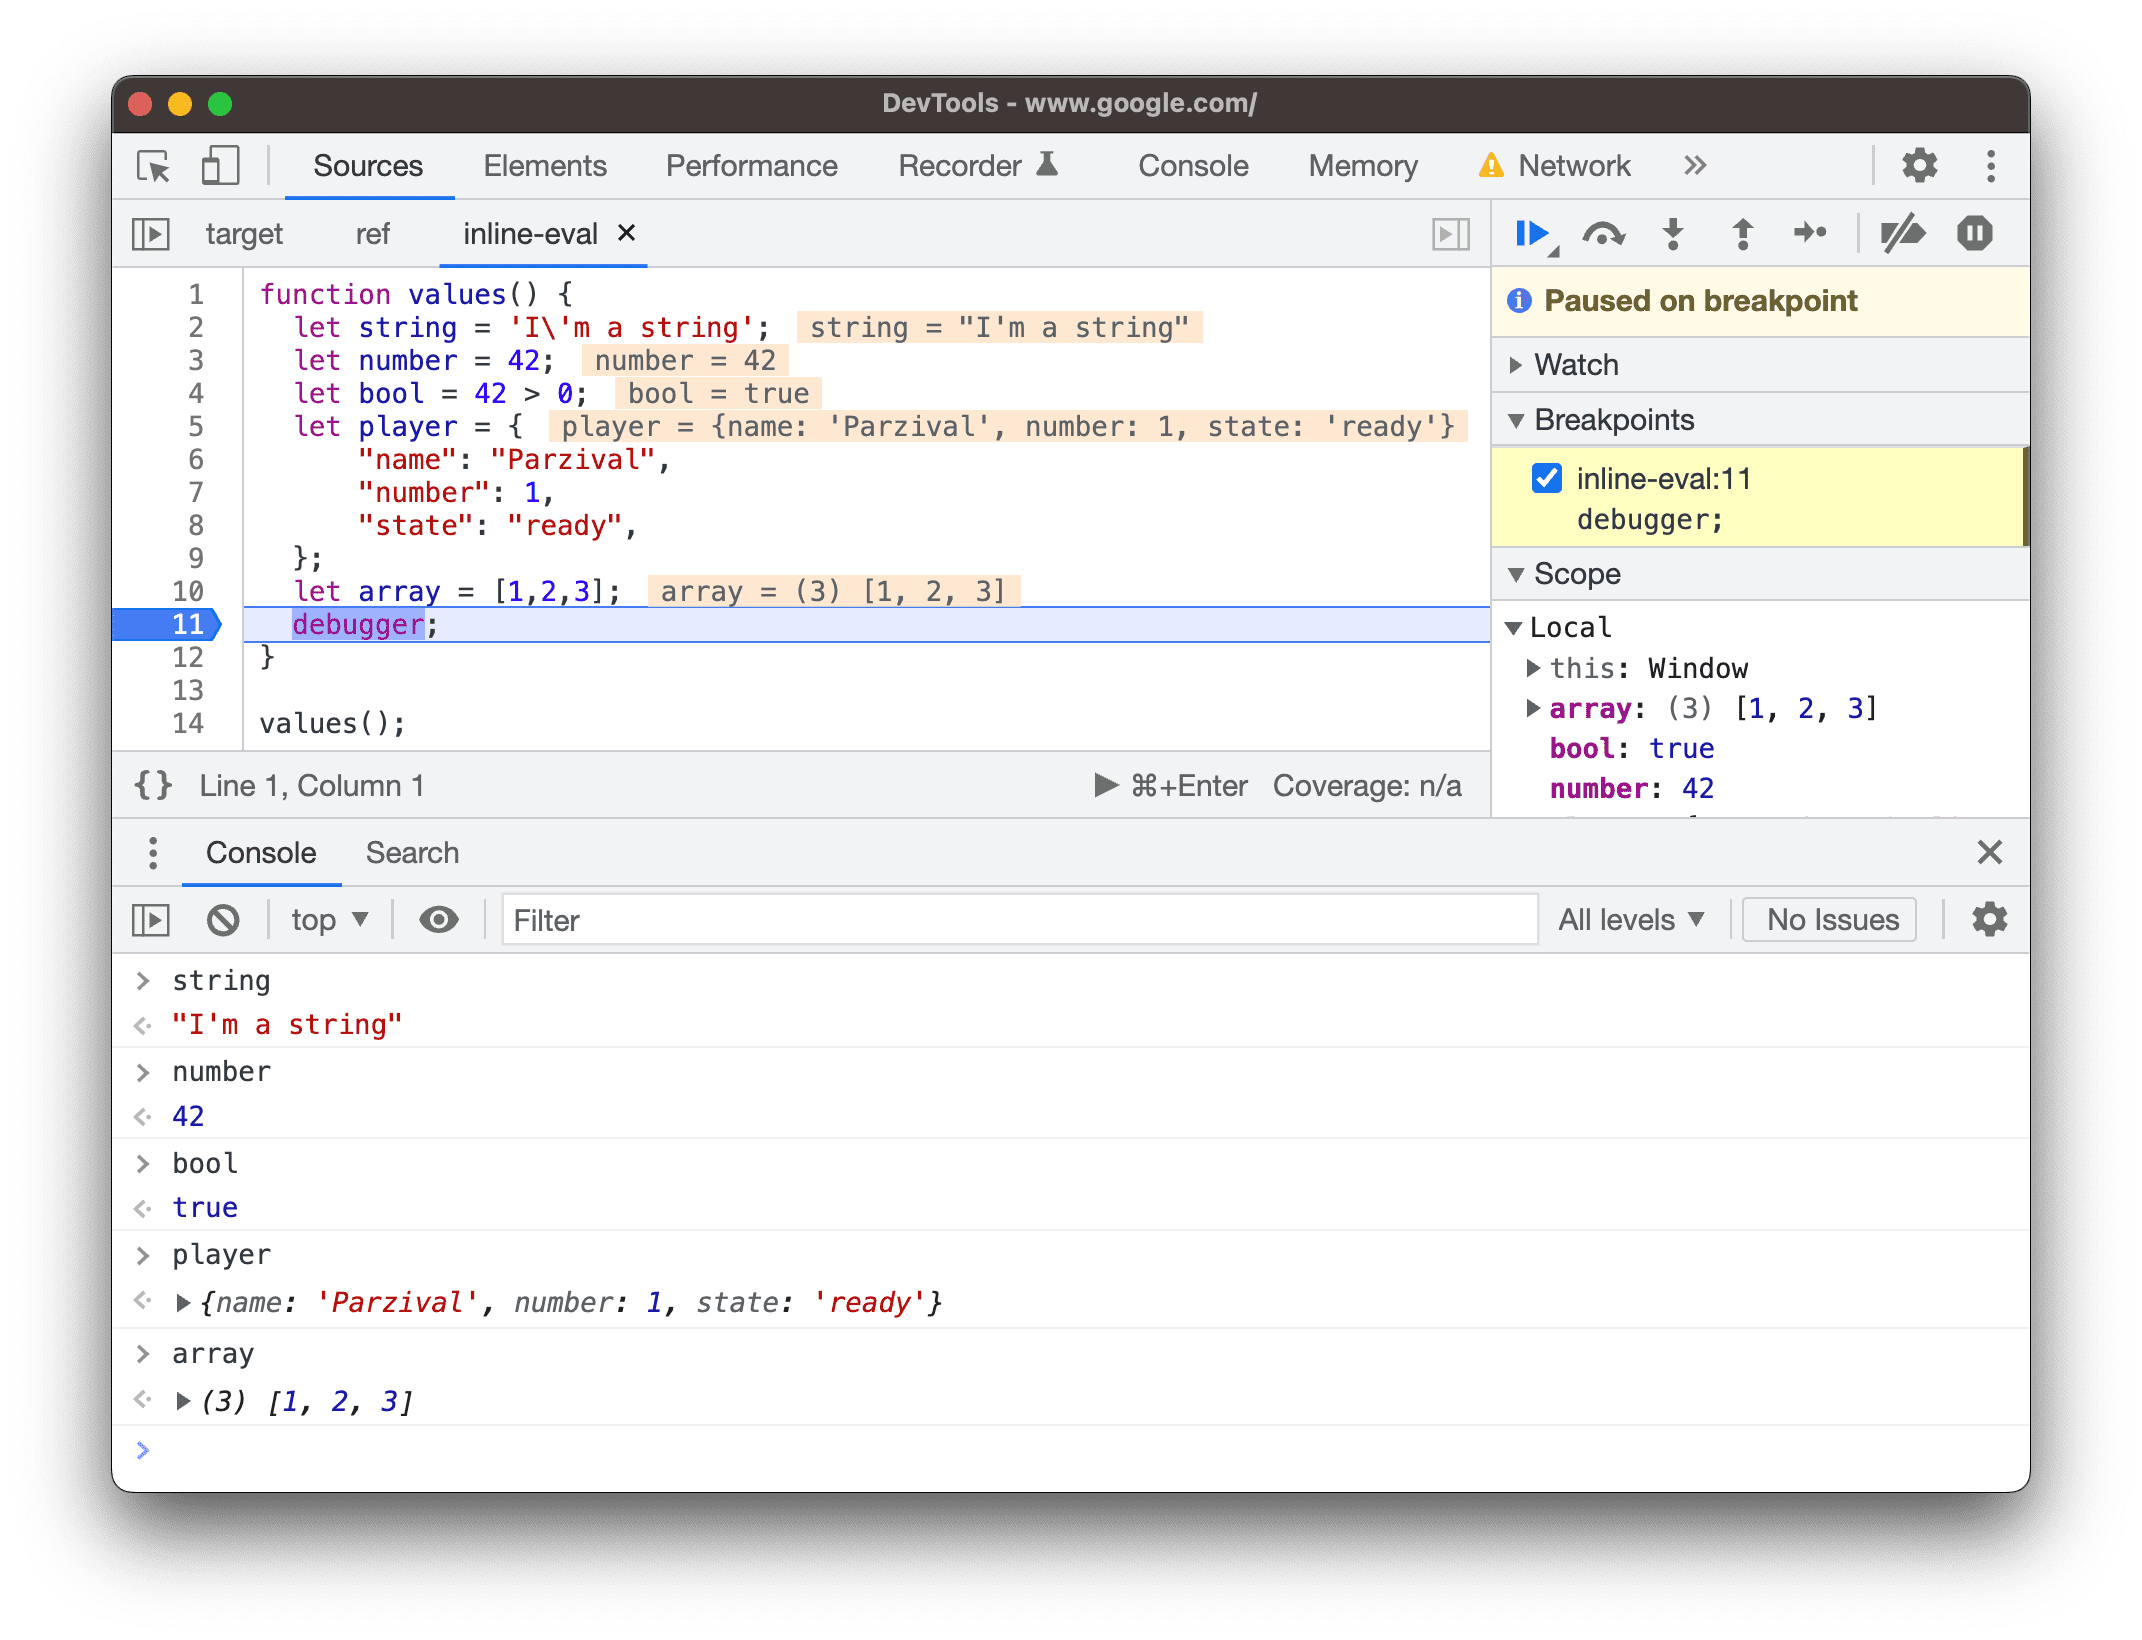
While the execution is paused, the debugger evaluates all variables, constants, and objects within the current function up to a breakpoint. The debugger shows the current values inline next to the corresponding declarations.

You can use the Console to query the evaluated variables, constants, and objects.
Preview class and function properties on hover
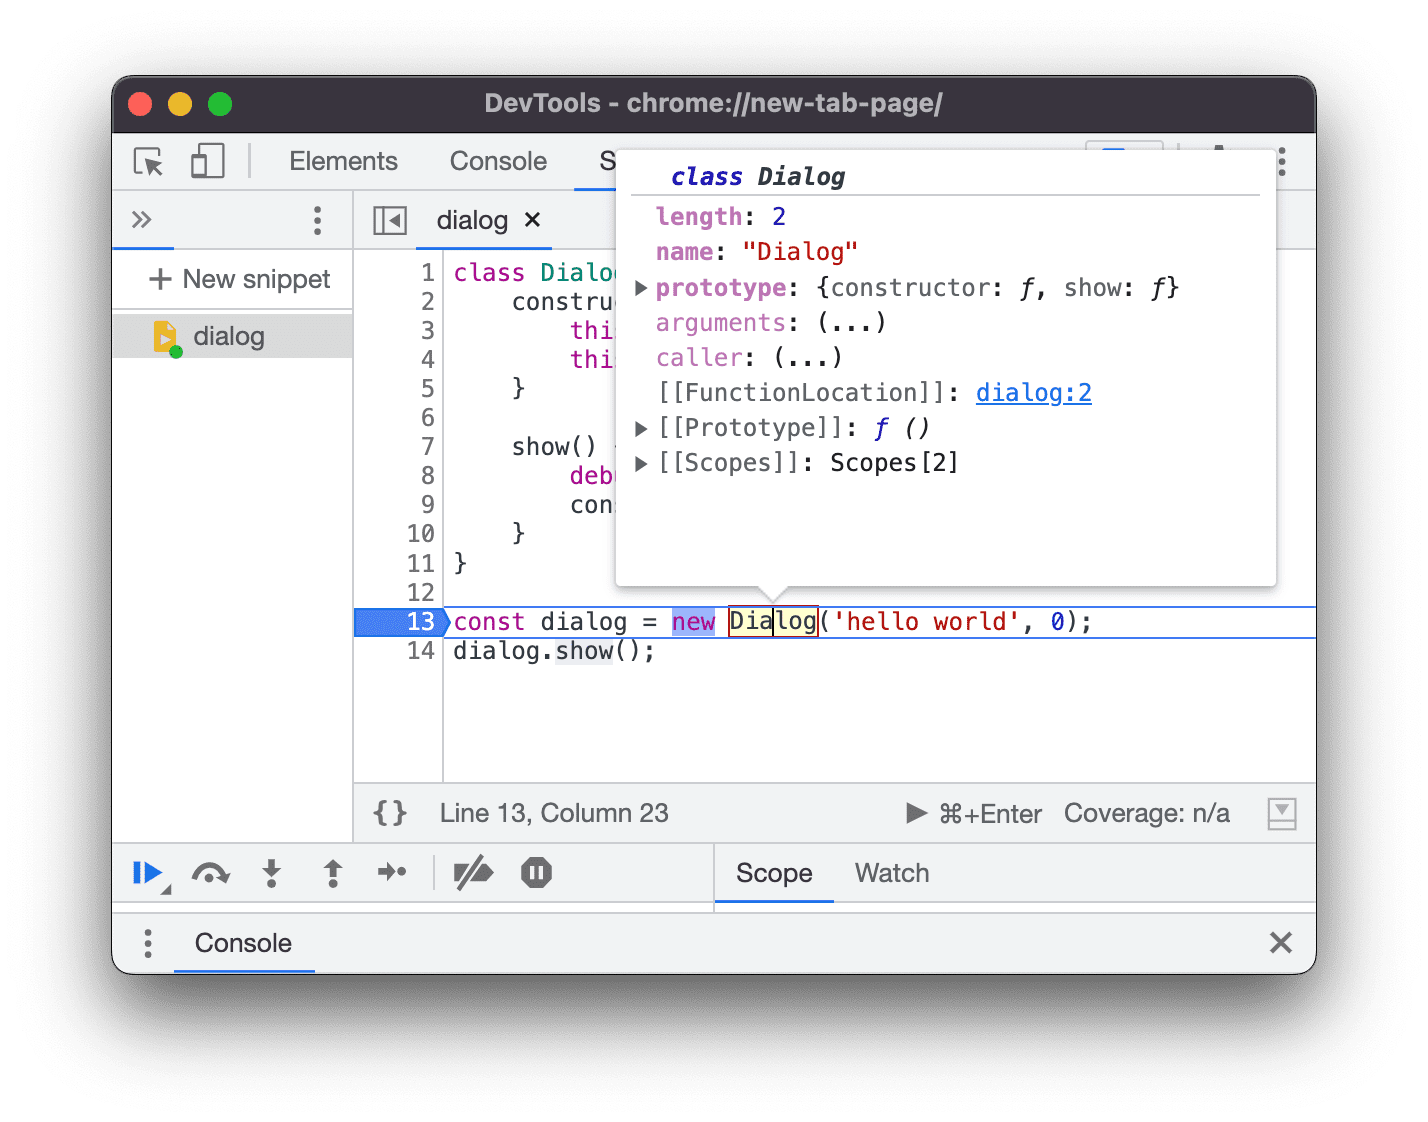
While the execution is paused, hover over a class or function name to preview its properties.
Step through code
Once your code is paused, step through it, one expression at a time, investigating control flow and property values along the way.
Step over line of code
When paused on a line of code containing a function that's not relevant to the problem you're debugging, click Step overstep_over to execute the function without stepping into it.

For example, suppose you're debugging the following code:
functionupdateHeader(){ varday=newDate().getDay(); varname=getName();// A updateName(name);// D}functiongetName(){ varname=app.first+' '+app.last;// B returnname;// C}You're paused on A. Once you've pressed step_over, DevTools executes all the code in the function that you're stepping over, which is B and C. DevTools then pauses on D.
Step into line of code
When paused on a function call that is related to the problem you're debugging, click Step into![]() to investigate that function.
to investigate that function.

For example, suppose you're debugging the following code:
functionupdateHeader(){ varday=newDate().getDay(); varname=getName();// A updateName(name);}functiongetName(){ varname=app.first+' '+app.last;// B returnname;}You're paused on A. By pressing Step into, DevTools executes this line of code, then pauses on B.
Step out of line of code
When paused inside of a function that is not related to the problem you're debugging, click step_out to execute the rest of the function's code.

For example, suppose you're debugging the following code:
functionupdateHeader(){ varday=newDate().getDay(); varname=getName(); updateName(name);// C}functiongetName(){ varname=app.first+' '+app.last;// A returnname;// B}You're paused on A. By clicking step_out, DevTools executes the rest of the code in getName(), which is just B in this example, and then pauses on C.
Run all code up to a certain line
When debugging a long function, there may be a lot of code that is not related to the problem you're debugging.
You could step through all the lines, but that can be tedious. You could set a line-of-code breakpoint on the line you're interested in and then press resume, but there's a faster way.
Right-click the line of code that you're interested in, and select Continue to here. DevTools runs all of the code up to that point, and then pauses on that line.

Resume script execution
To continue your script's execution after a pause, click resume. DevTools executes the script up until the next breakpoint, if any.

Force script execution
To ignore all breakpoints and force your script to resume execution, click and hold Resume Script Executionresume and then select Force script executionplay_arrow.
Change thread context
When working with web workers or service workers, click a context listed in the Threads pane to switch to that context. The blue arrow icon represents which context is selected.

For example, suppose that you're paused on a breakpoint in both your main script and your service worker script. You want to view the local and global properties for the service worker context, but the Sources panel is showing the main script context. By clicking on the service worker entry in the Threads pane, you'd be able to switch to that context.
Step through comma-separated expressions
You can debug minified code by stepping through comma-separated expressions. For example, consider the following code:
functionfoo(){}functionbar(){foo();foo();return42;}bar();When minified, it contains a comma-separated foo(),foo(),42 expression:
functionfoo(){}functionbar(){returnfoo(),foo(),42}bar();The Debugger steps through such expressions just the same.

Therefore, the stepping behavior is identical:
- Between minified and authored code.
- When using source maps to debug the minified code in terms of the original code. In other words, when you see semicolons, you can always expect to step through them even if the source you're debugging is minified.
View and edit local, closure, and global properties
While paused on a line of code, use the Scope pane to view and edit the values of properties and variables in the local, closure, and global scopes.
- Double-click a property value to change it.
- Non-enumerable properties are greyed out.

View the current call stack
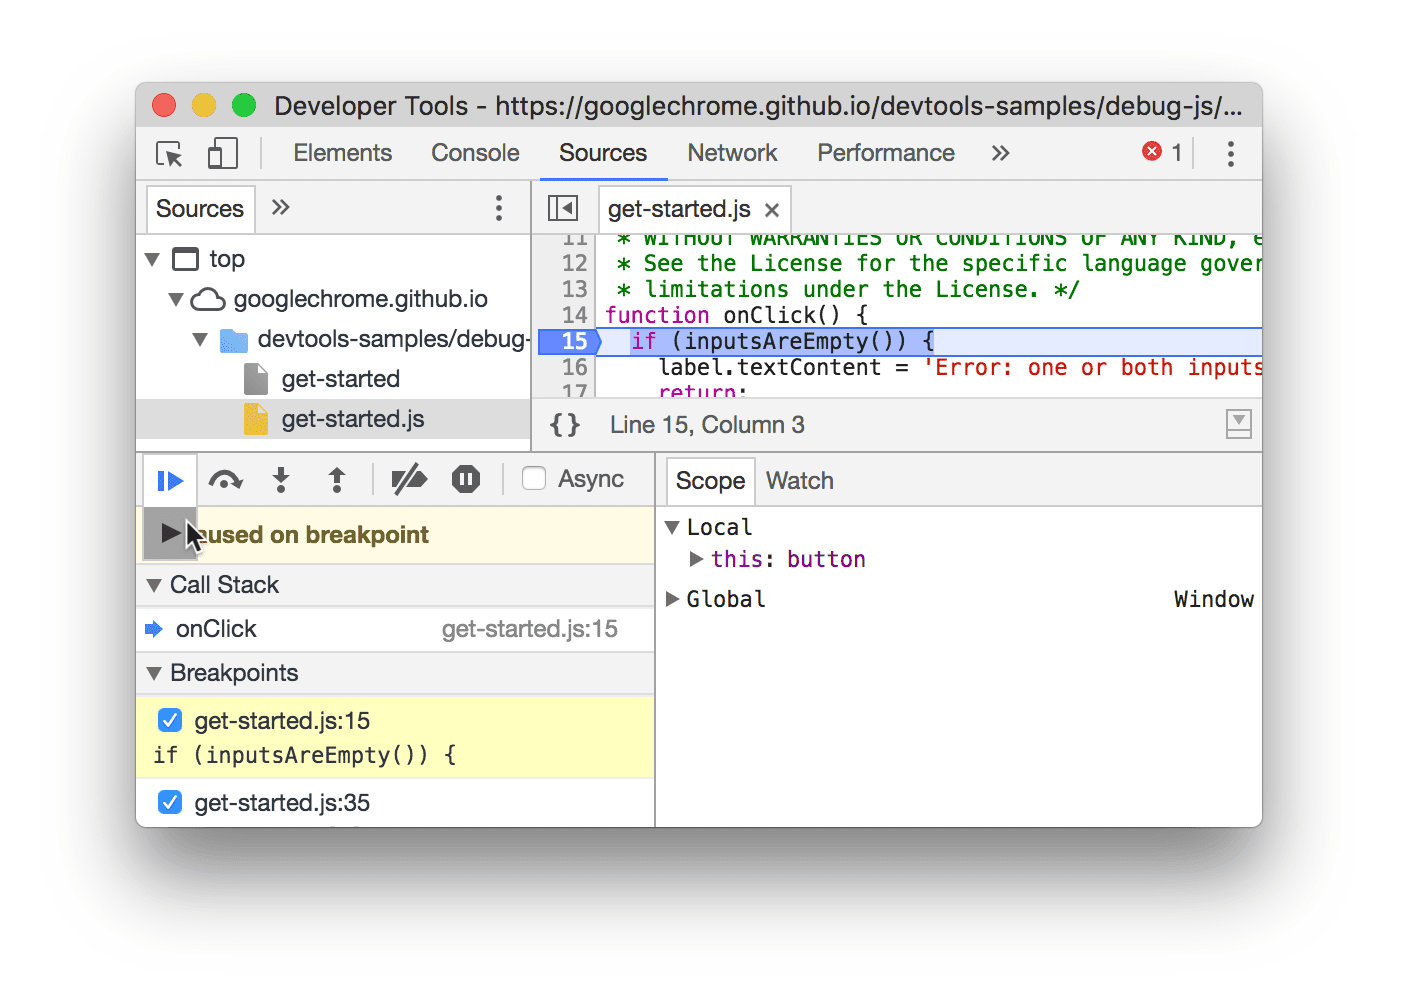
While paused on a line of code, use the Call Stack pane to view the call stack that got you to this point.
Select an entry to jump to the line of code where that function was called. The blue arrow icon represents which function DevTools is highlighting.

Restart a function (frame) in a call stack
To observe the behavior of a function and re-run it without having to restart the entire debugging flow, you can restart the execution of a single function when this function is paused. In other words, you can restart the function's frame in the call stack.
To restart a frame:
- Pause function execution at a breakpoint. The Call Stack pane records the order of function calls.
In the Call Stack pane, right-click a function and select Restart frame from the drop-down menu.

To understand how Restart frame works, consider the following:
functionfoo(value){console.log(value);bar(value);}functionbar(value){value++;console.log(value);debugger;}foo(0);The foo() function takes 0 as an argument, logs it, and calls the bar() function. The bar() function, in turn, increments the argument.
Try restarting the frames of both functions as follows:
Copy the example code to a new snippet and run it. The execution stops at the
debuggerline-of-code breakpoint.Notice that the debugger shows you the current value next to function declaration:
value = 1.
Restart the
bar()frame.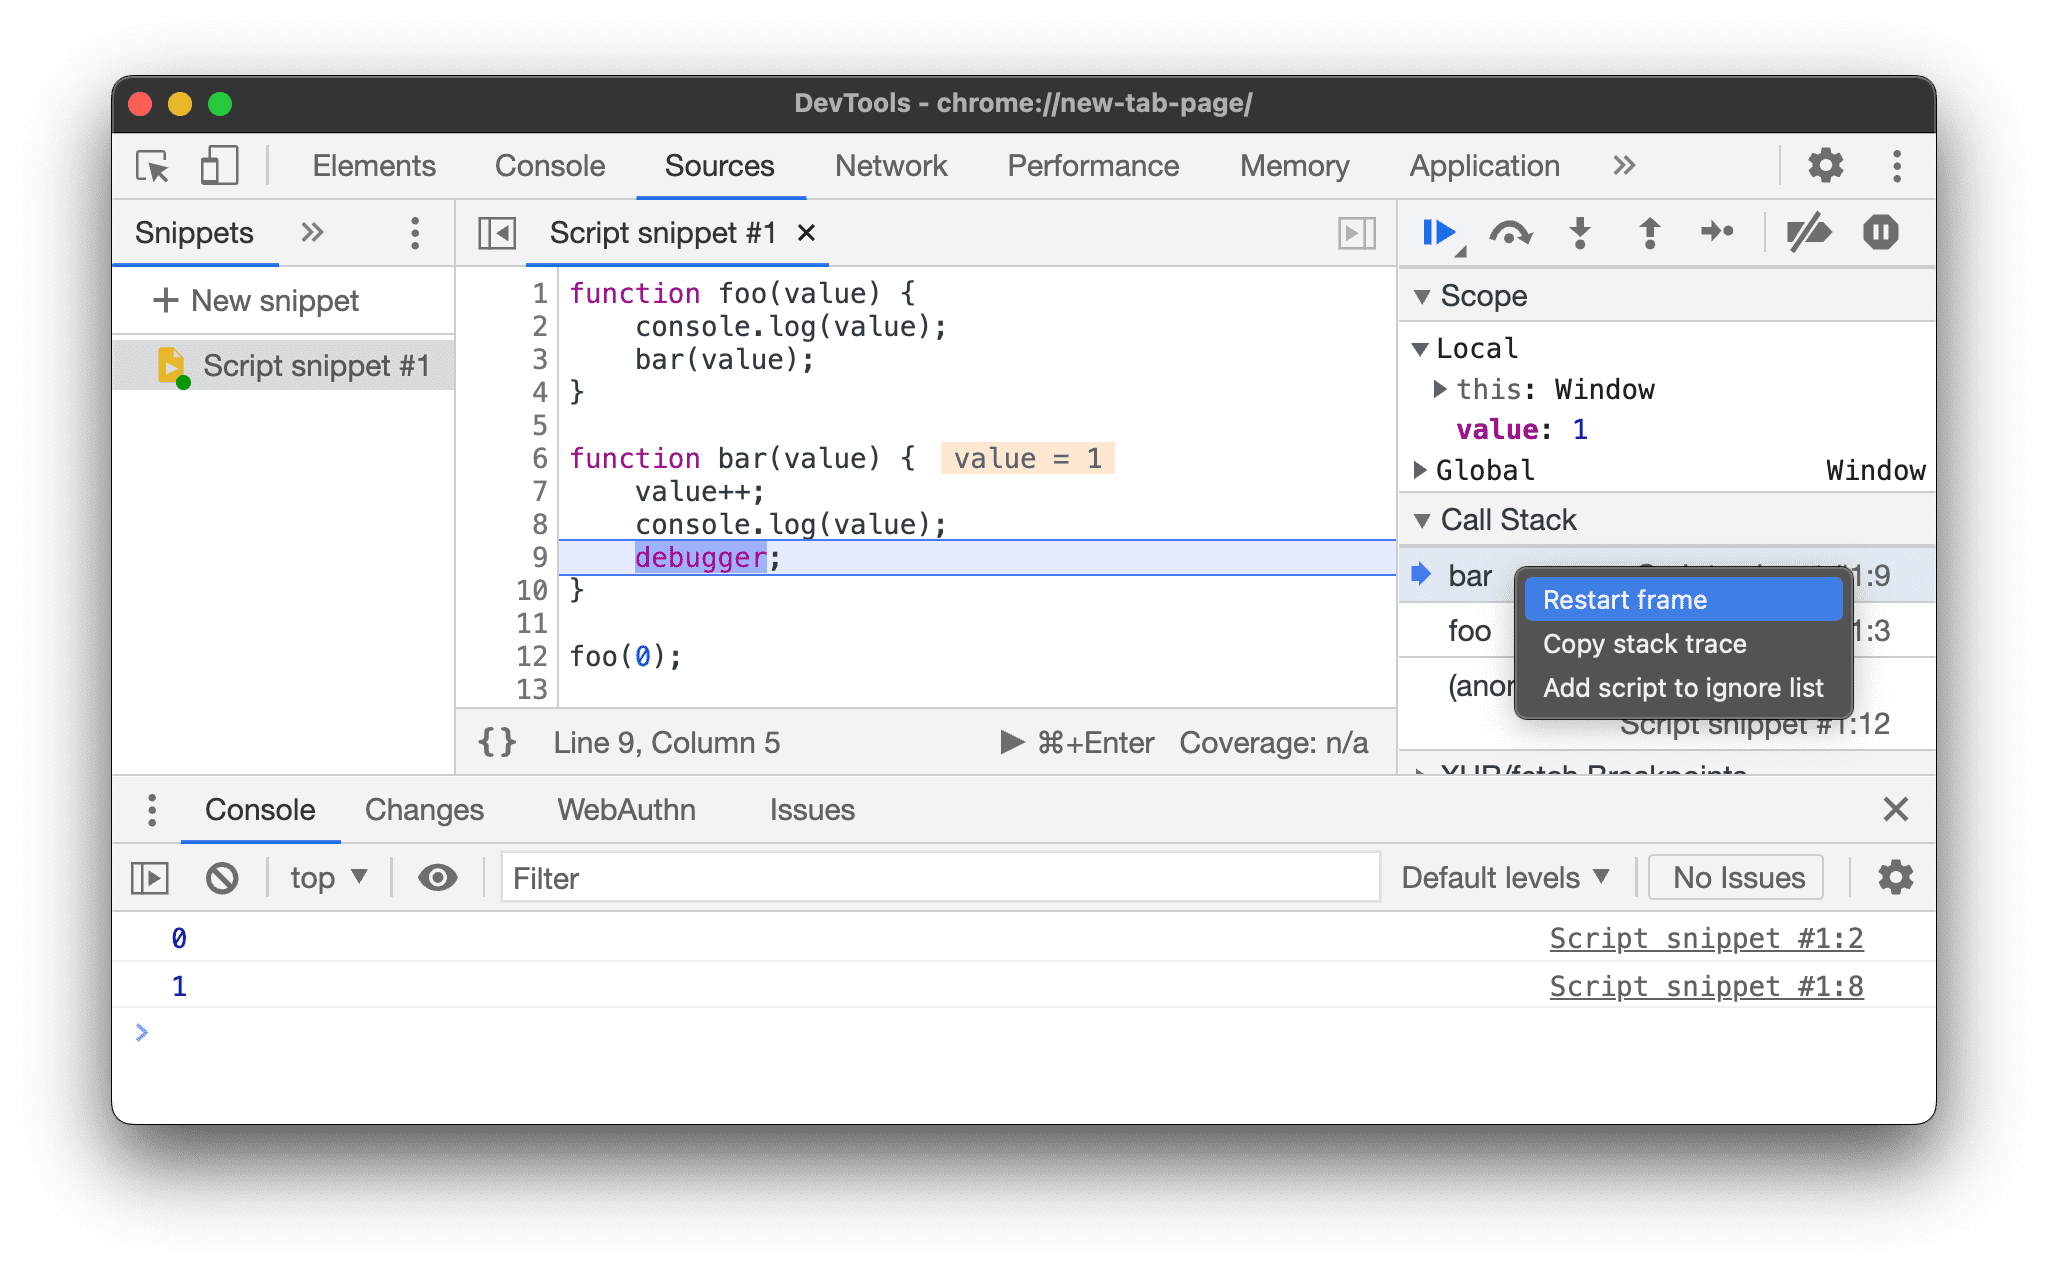
Step through the value increment statement by pressing
F9. Notice that the current value increases:
 value = 2.Optionally, in the Scope pane, double-click the value to edit it and set the desired value.

Try restarting the
bar()frame and stepping through the increment statement several more times. The value continues to increase.
Restart the
foo()frame in the Call Stack. Notice that the value is
 0again.
Resume script execution (
F8) to complete this tutorial.
Show ignore-listed frames
By default, the Call Stack pane shows only the frames that are relevant to your code and omits any scripts added to settingsSettings > Ignore List.

To view the full call stack including third-party frames, enable Show ignore-listed frames under the Call Stack section.
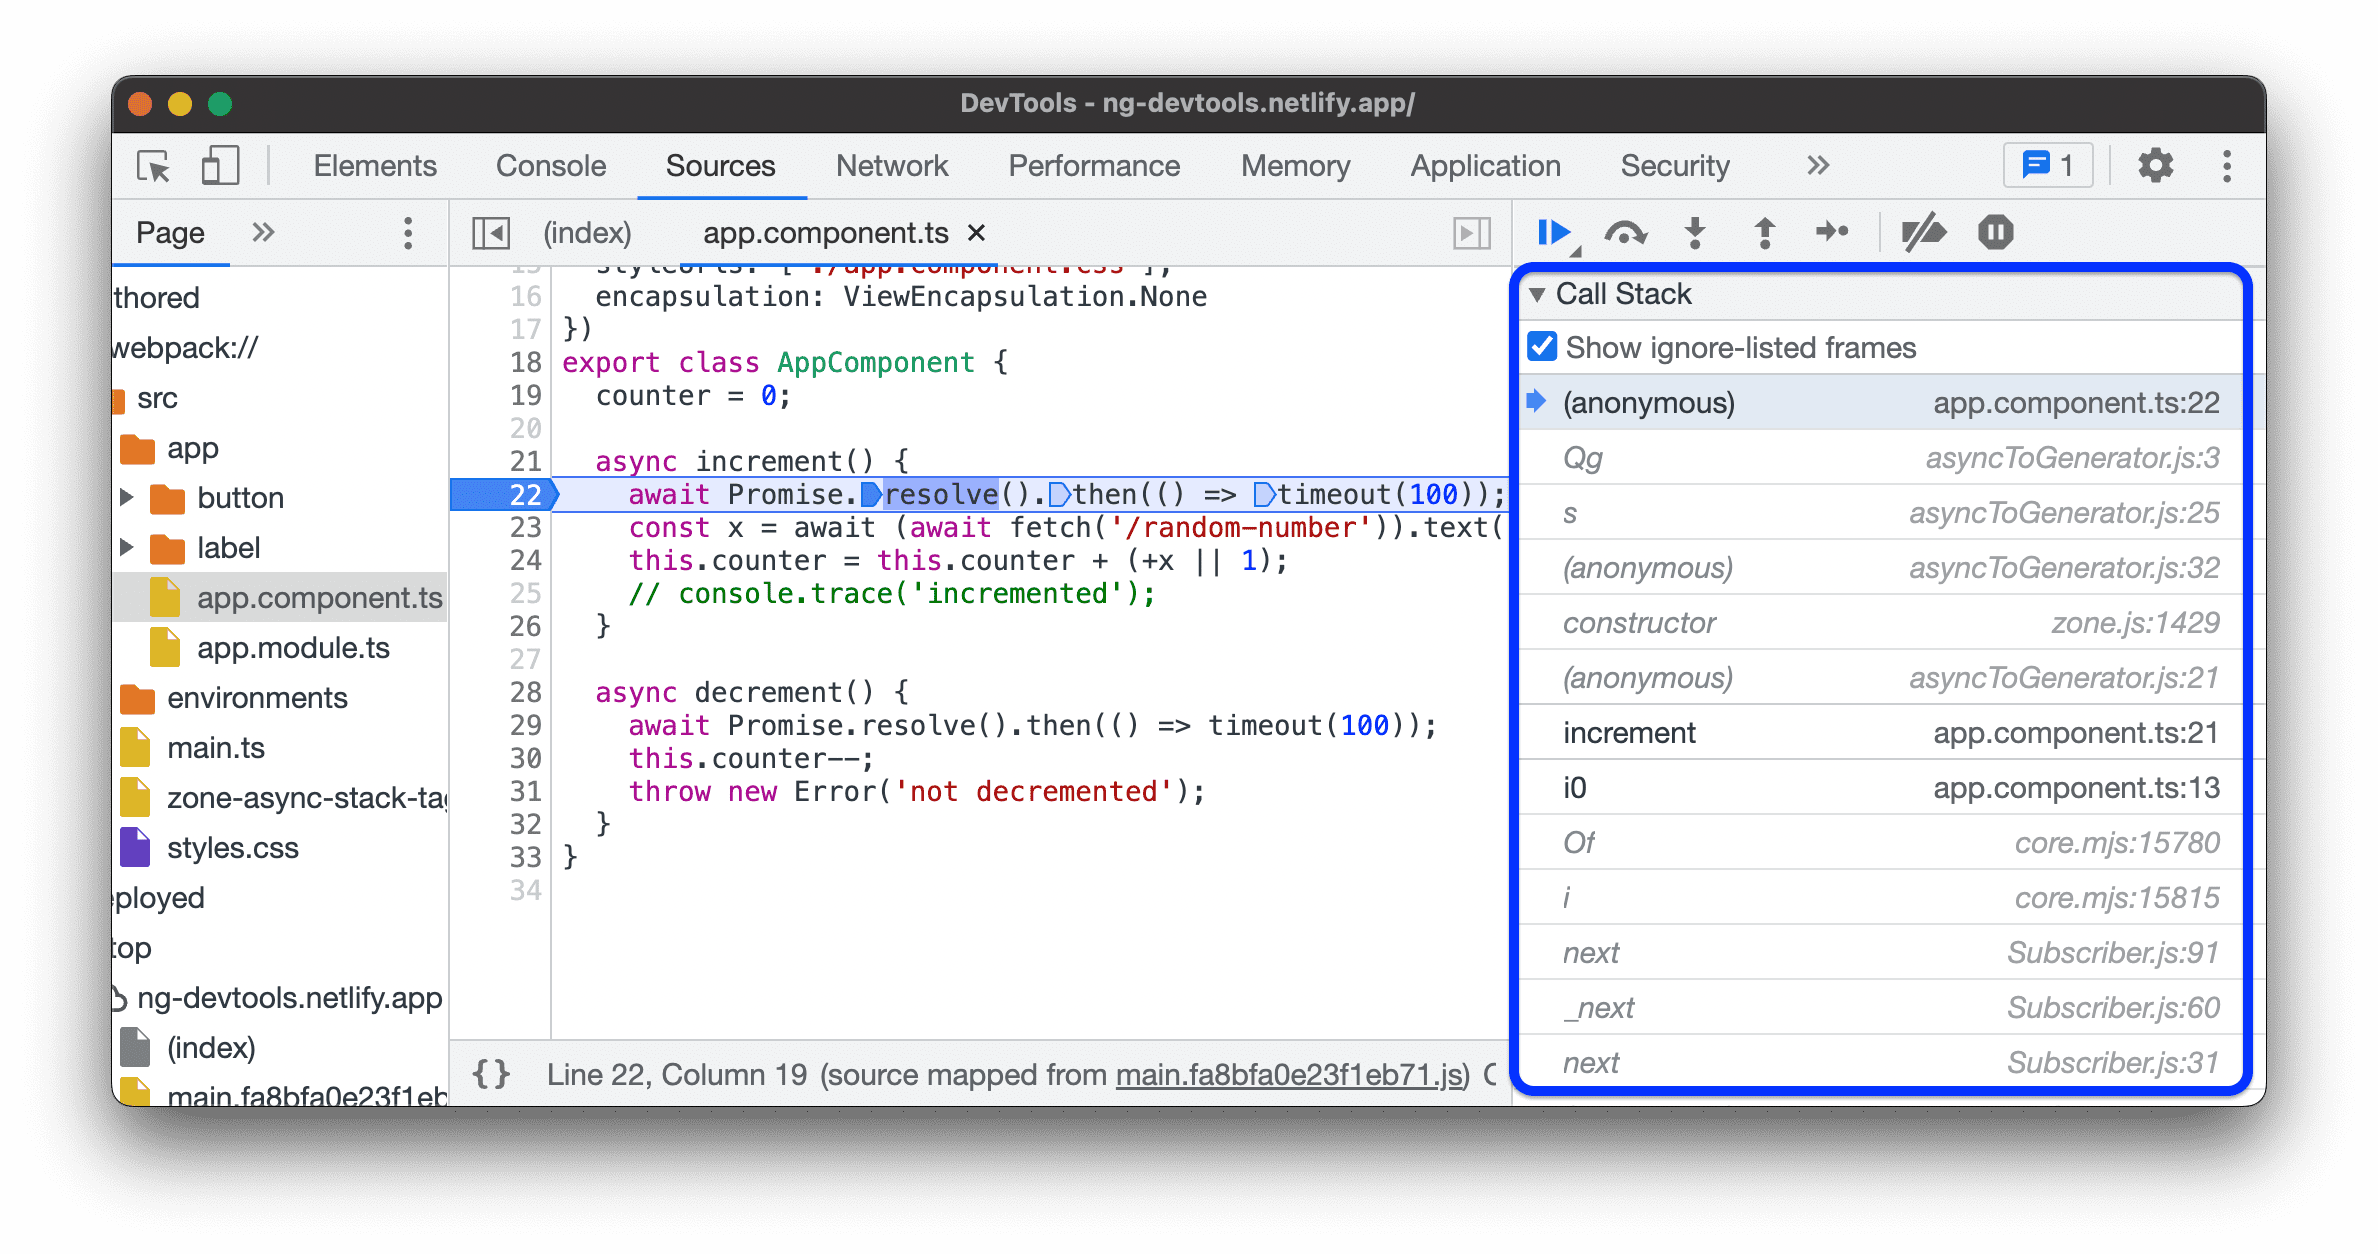
Try it in this demo:
- In the Sources panel, open the
src>app>app.component.tsfile. - Set a breakpoint at the
increment()function. - In the Call Stack section, check or clear the Show ignore-listed frames checkbox and observe the relevant or full list of frames in the call stack.
View async frames
If supported by the framework you are using, DevTools can trace async operations by linking both parts of the async code together.
In this case, the Call Stack shows the entire call history including async call frames.
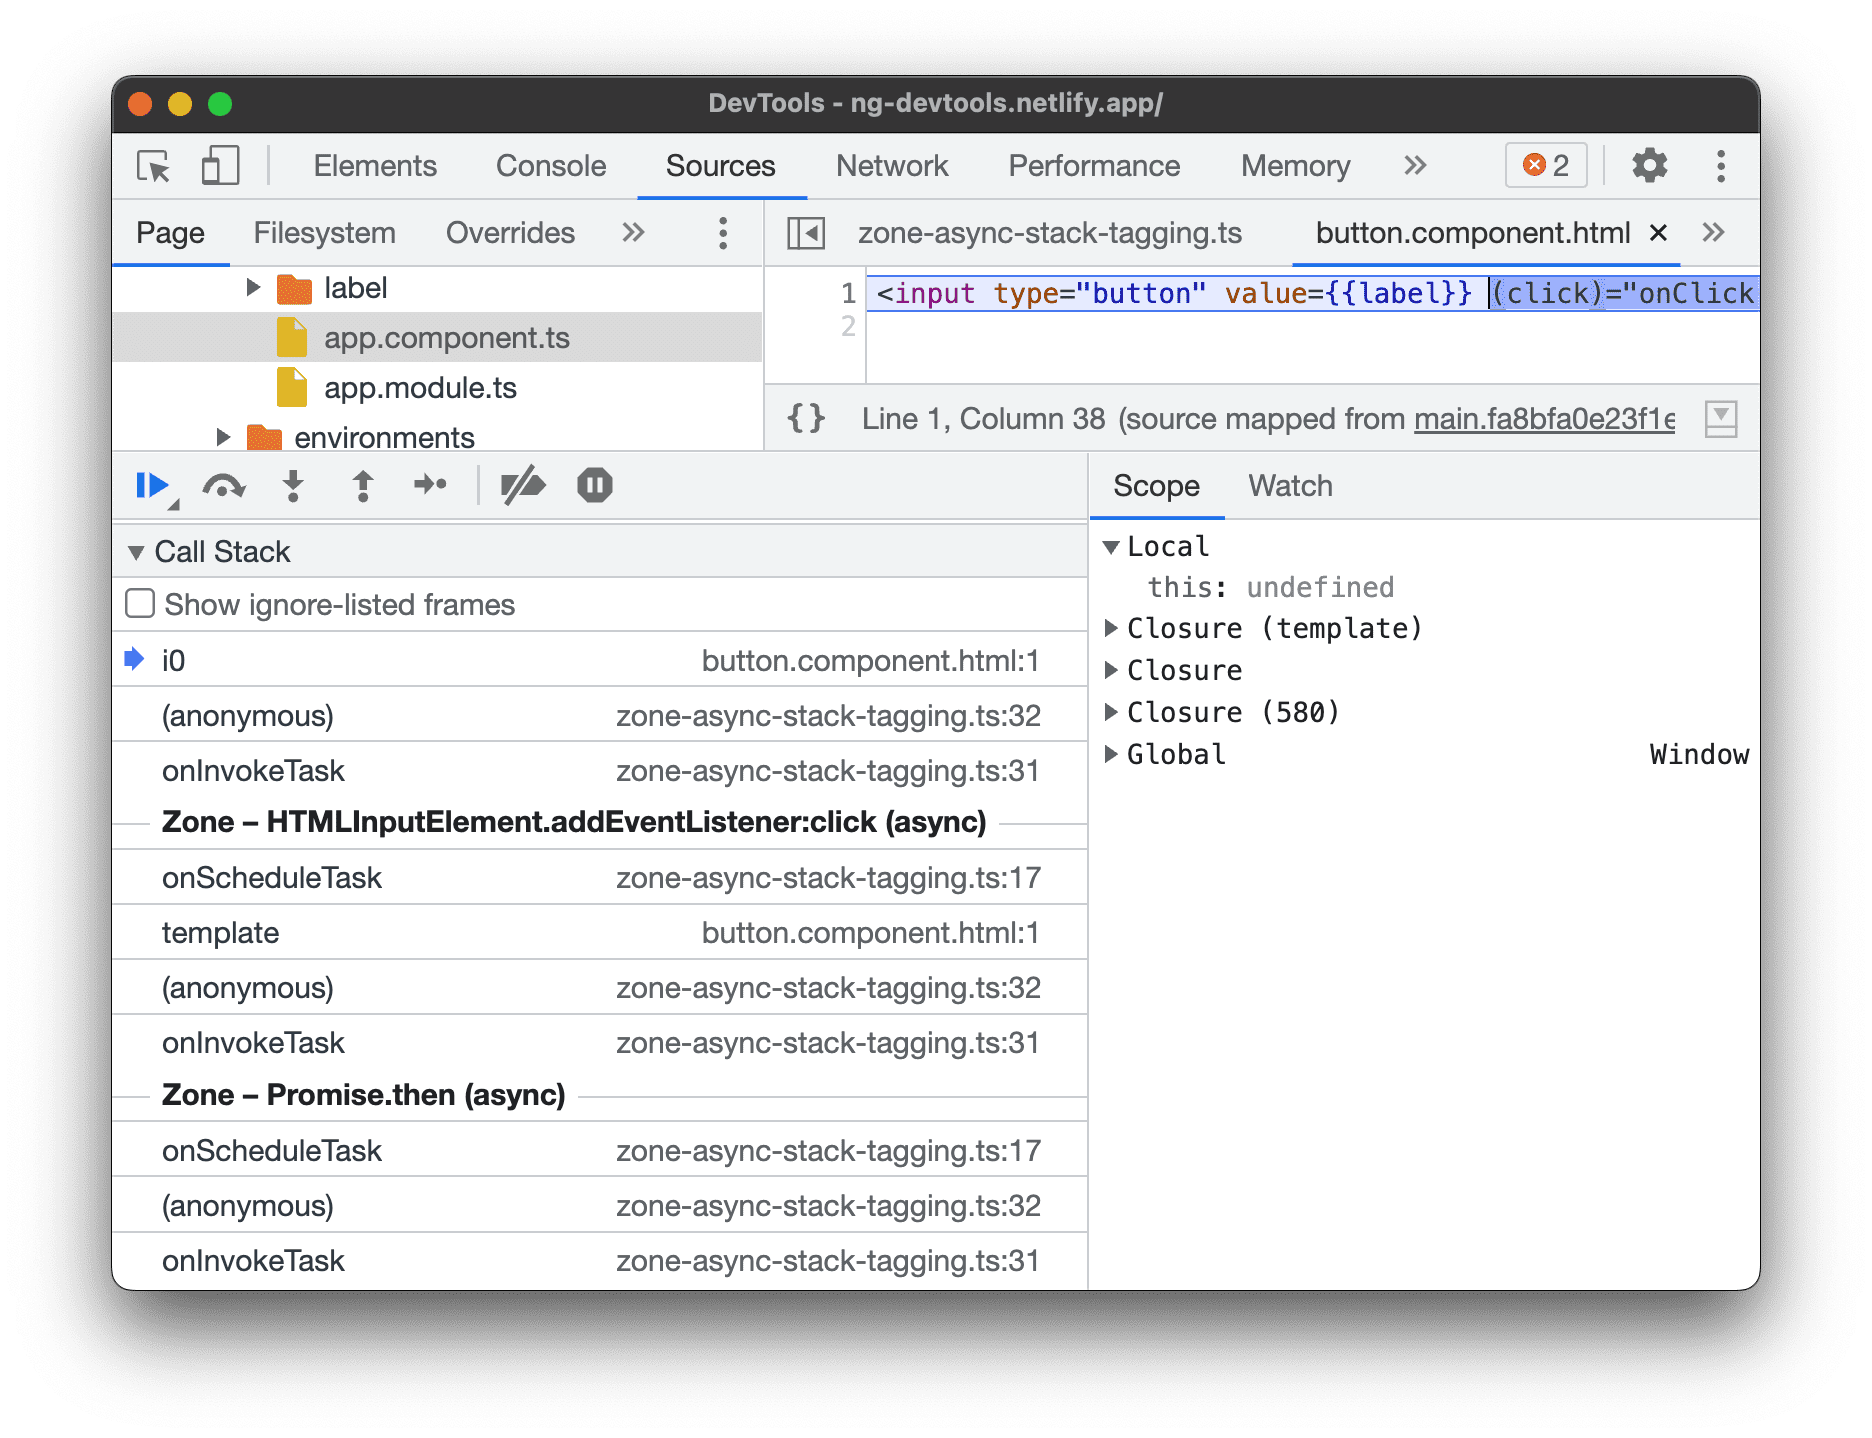
Key Point DevTools implements this "Async Stack Tagging" feature based on the console.createTask() API method. It's up to frameworks to implement the API. For example, Angular supports this feature.
Copy stack trace
Right-click anywhere in the Call Stack pane and select Copy stack trace to copy the current call stack to the clipboard.

Here is an example of the output:
getNumber1(get-started.js:35)inputsAreEmpty(get-started.js:22)onClick(get-started.js:15)Navigate the file tree
Use the Page pane to navigate the file tree.
Group authored and deployed files in the file tree
When developing web applications using frameworks (for example, React or Angular), it can be difficult to navigate sources due to the minified files generated by the build tools (for example, webpack or Vite).
To help you navigate sources, the Sources > Page pane can group the files into two categories:
- codeAuthored. Similar to the source files you view in your IDE. DevTools generates these files based on source maps provided by your build tools.
 Deployed. The actual files that the browser reads. Usually these files are minified.
To enable grouping, click more_vert > Group files by Authored/Deployed![]() option, under the menu at the top of the file tree.
option, under the menu at the top of the file tree.

Hide ignore-listed sources from the file tree
To help you focus only on the code you create, the Sources > Page pane grays out all scripts or directories added to settingsSettings > Ignore List by default.
To hide such scripts altogether, select Sources > Page > more_vert > Hide ignore-listed sources![]() .
.

Ignore a script or pattern of scripts
Ignore a script to skip it while debugging. When ignored, a script is obscured in the Call Stack pane, and you never step into the script's functions when you step through your code.
For example, suppose you're stepping through this code:
functionanimate(){ prepare(); lib.doFancyStuff();// A render();}A is a third-party library that you trust. If you're confident that the problem you're debugging is not related to the third-party library, then it makes sense to ignore the script.
Ignore a script or a directory from the file tree
To ignore an individual script or an entire directory:
- In Sources > Page, right-click a directory or a script file.
- Select Add directory/script to ignore list.

If you didn't hide ignore-listed sources, you can select such a source in the file tree and, on the warning warning banner, click Remove from ignored list or Configure.

Otherwise, you can remove hidden and ignored directories and scripts from the list in settingsSettings > Ignore List.
Ignore a script from the Editor pane
To ignore a script from the Editor pane:
- Open the file.
- Right-click anywhere.
- Select Add script to ignore list.

You can remove a script from the list of ignored from settingsSettings > Ignore List.
Ignore a script from the Call Stack pane
To ignore a script from the Call Stack pane:
- Right-click on a function from the script.
- Select Add script to ignore list.

You can remove a script from the list of ignored from settingsSettings > Ignore List.
Ignore a script from Settings
See settingsSettings > Ignore List.
Run snippets of debug code from any page
If you find yourself running the same debug code in the Console over and over, consider Snippets. Snippets are executable scripts that you author, store, and run within DevTools.
See Run Snippets of Code From Any Page to learn more.
Watch the values of custom JavaScript expressions
Use the Watch pane to watch the values of custom expressions. You can watch any valid JavaScript expression.

- Click Add Expressionadd to create a new watch expression.
- Click Refreshrefresh to refresh the values of all existing expressions. Values automatically refresh while stepping through code.
- Hover over an expression and click Delete Expression
 to delete it.
Inspect and edit scripts
When you open a script in the Page pane, DevTools shows you its contents in the Editor pane. In the Editor pane, you can browse and edit your code.
Additionally, you can override the contents locally or create a workspace and save the changes you make in DevTools directly to your local sources.
Make a minified file readable
By default, the Sources panel pretty-prints minified files. When pretty-printed, the Editor may show a single long code line in multiple lines, with - to indicate that it's the line continuation.

To see the minified filed as it was loaded, click data_object in the bottom left corner of the Editor.
Fold code blocks
To fold a code block, hover over the line number in the left column and click arrow_drop_downCollapse.
To unfold the code block, click {...} next to it.
To configure this behavior, see settingsSettings > Preferences > Sources.
Edit a script
When fixing a bug, you often want to test out some changes to your JavaScript. You don't need to make the changes in an external browser and then reload the page. You can edit your script in DevTools.
To edit a script:
- Open the file in the Editor pane of the Sources panel.
- Make your changes in the Editor pane.
Press Command+S (Mac) or Ctrl+S (Windows, Linux) to save. DevTools patches the entire JavaScript file into Chrome's JavaScript engine.

The Editor pane is outlined in blue.
Edit a paused function live
While the execution is paused, you can edit the current function and apply changes live with the following limitations:
- You can edit only the top-most function in the Call Stack.
- There must be no recursive calls to the same function further down the stack.
To live-edit a function:
- Pause the execution with a breakpoint.
- Edit the paused function.
- Press Command / Control + S to apply changes. The debugger restarts the function automatically.
- Continue the execution.
Watch the video to learn this workflow.
In this example, the addend1 and addend2 variables initially have an incorrect string type. So, instead of adding numbers, the strings are concatenated. To fix it, the parseInt() functions are added during live editing.
Search and replace text in a script
To search for text in a script:
- Open the file in the Editor pane of the Sources panel.
- To open a built-in search bar, press Command+F (Mac) or Ctrl+F (Windows, Linux).
- In the bar, enter your query.
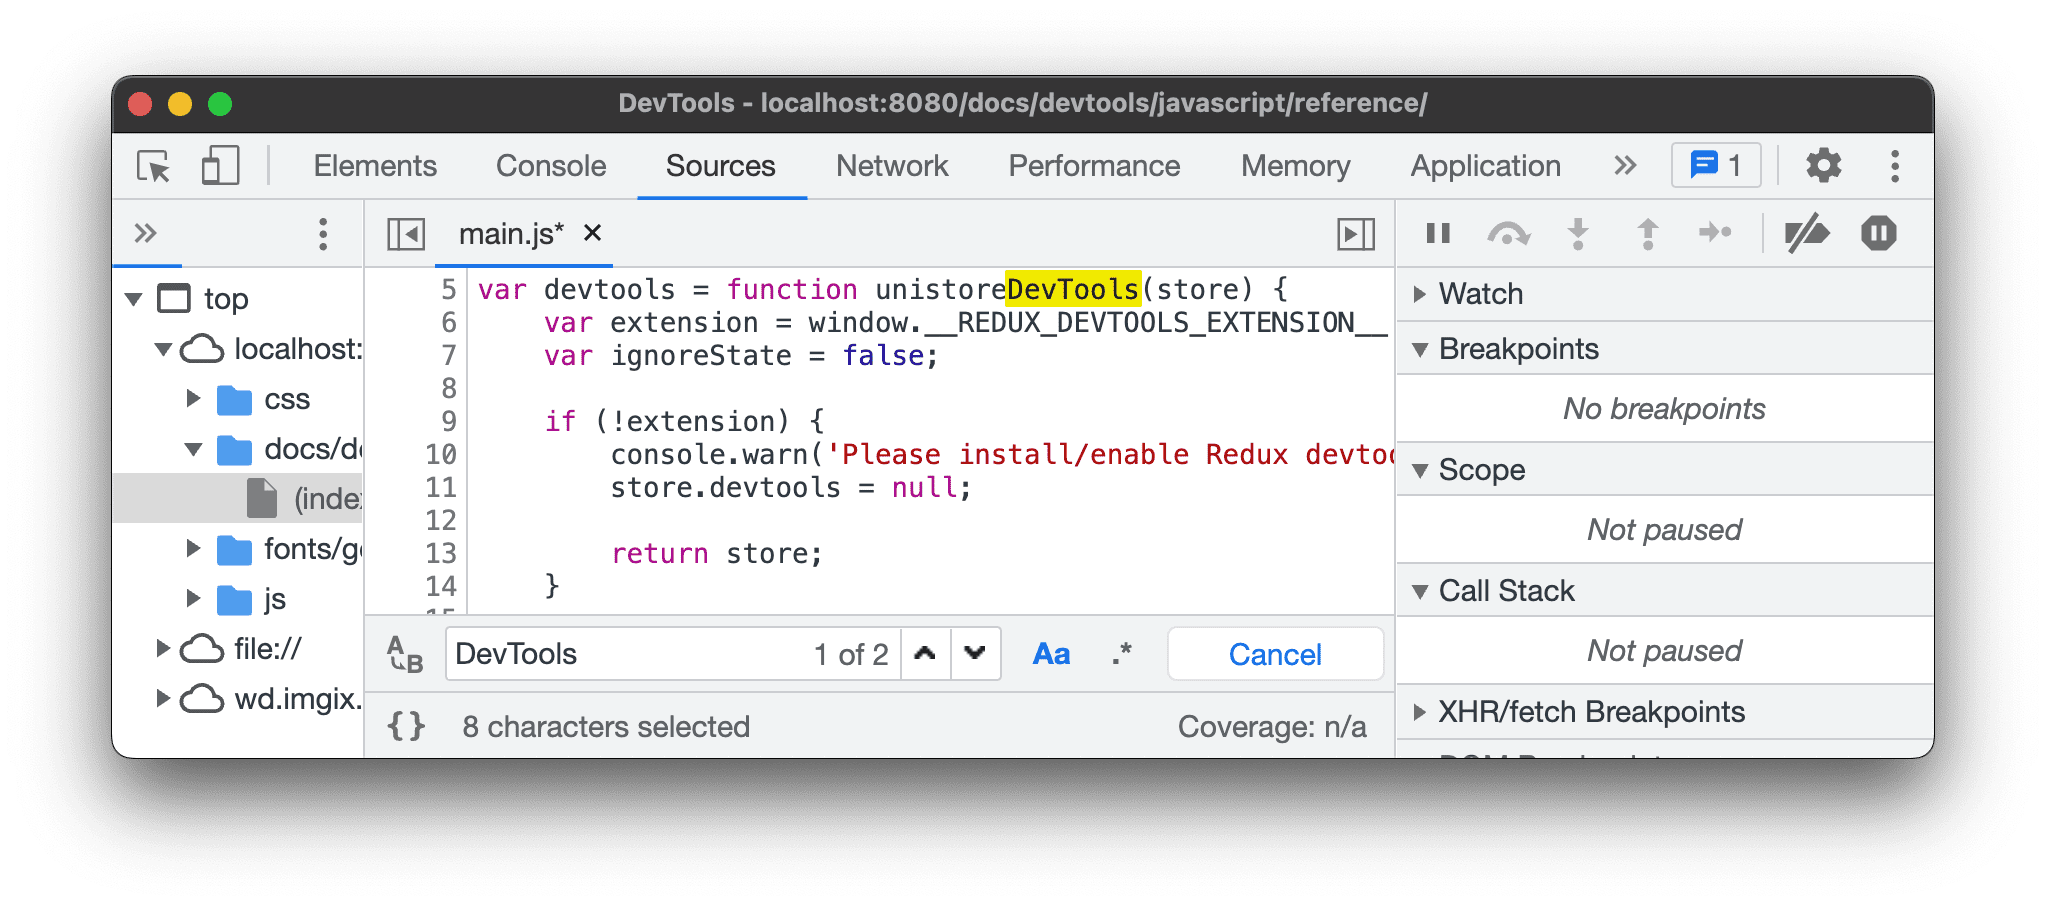 Optionally, you can:
 - Click
 Match Case to make your query case-sensitive.
 - Click
 Use Regular Expression to search using a RegEx expression.
- Click
- Press Enter. To jump to previous or next search result, press the up or down button.
To replace the text you found:
- On the search bar, click
 Replace.
- Type the text to replace with, then click Replace or Replace all.