1
$\begingroup$

Consider the following test function:

func[x_] = x^3 Exp[-x^2]; 

In general, it may be an arbitrary function without e.g. extrema.

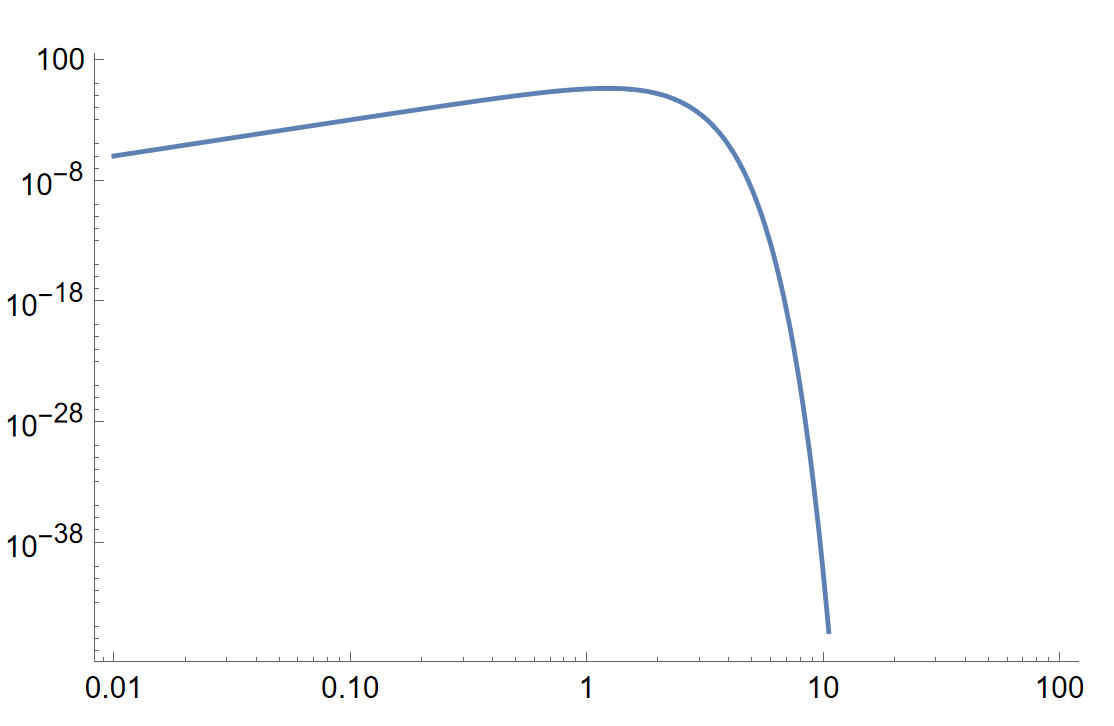
I want to plot it:

LogLogPlot[func[x], {x, 0.01, 100}] 

enter image description here

Due to the exponential decrease, the automatic PlotRange is down to a very small values.

I want to cut it from below by say 10^-15, but also to adjust the maximal value such that it would correspond to say 1.5*Max[func[x]]. The only thing I know is to use PlotRange:

LogLogPlot[func[x], {x, 0.01, 100}, PlotRange -> {All, {10^-15, 2}}] 

However, the second argument in {10^-15,2} is added by hand. Could you please tell me whether it is possible to make its evaluation automatic depending on the needs?

$\endgroup$
2
  • 1
    $\begingroup$Not sure how you chose $10^{-15}$ so I don't know how to do that algorithmically, but for the other end you could perhaps use NMaxValue[func[x], x] and an appropriate multiplier.$\endgroup$
    – MarcoB
    CommentedJun 2, 2023 at 13:18
  • 1
    $\begingroup$How should MMA know what your needs are?$\endgroup$CommentedJun 2, 2023 at 14:28

1 Answer 1

2
$\begingroup$

You could make a function to calculate the vertical bounds of the plot that takes the function as input and calculates the min and max of the function over the range {0.01, 100}. If the min is less than 10^-15, replace it with 10^-15. If you want to calculate the bounds for ranges other than {0.01,100}, you could make those inputs to the function as well:

func[x_] = x^3 Exp[-x^2]; yBounds[f_] := {1.5*MaxValue[{f[x], 0.01 <= x <= 100}, x], Max[MinValue[{f[x], 0.01 <= x <= 100}, x], 10^-15]} LogLogPlot[func[x], {x, 0.01, 100}, PlotRange -> {All, yBounds[func]}] 
$\endgroup$

    Start asking to get answers

    Find the answer to your question by asking.

    Ask question

    Explore related questions

    See similar questions with these tags.