Page
Create the Quarkus application

Let’s start by creating a simple Quarkus application exposing some metrics.
Note: We provide a final container image with all of the code, so you can skip the application creation if you are more interested in the observability part.
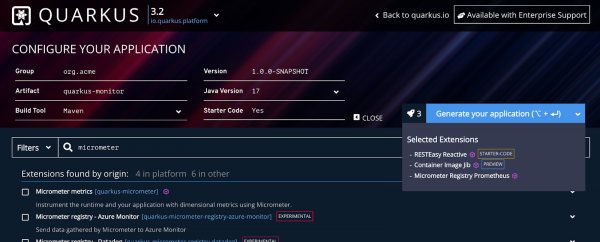
Go to https://code.quarkus.io/ and generate a new Quarkus application with RESTEasy Reactive, Container Image Jib, and Micrometer Registry Prometheus. Click the link to get a pre-populated page with all dependencies. Figure 1 shows the Quarkus generator page.

Now click the Generate your application button, download the zip file locally, and unzip it. With just the Micrometer extension, some JVM-specific metrics are automatically exposed.
Let’s add some custom metrics—for example, the value of a counter that is incremented using a REST endpoint.
Modify the application code
Open the code in your IDE and edit the org.acme.GreetingResource class with the following content:
// This is the main Micrometer class to register custom metrics private final MeterRegistry registry; // The data to monitor private AtomicInteger currentMemory; // Injects the Micrometer registry GreetingResource(MeterRegistry registry) { this.registry = registry; // Registers this metric under current.memory name, initializing the counter to 0 currentMemory = this.registry.gauge("current.memory", Tags.empty(), new AtomicInteger(0)); } // Creates an endpoint to modify the observed variable @GET @Path("/consume/{amount}") @Produces(MediaType.TEXT_PLAIN) public Integer consume(@PathParam("amount") int mem) { this.currentMemory.addAndGet(mem); return this.currentMemory.get(); }Of course, you need to import these classes too:
import io.micrometer.core.instrument.MeterRegistry; import io.micrometer.core.instrument.Tags; import jakarta.ws.rs.PathParam;Configure Jib
The final step is configuring Jib to push the container image to the registry. In this case, I used my quay.io account, but you should add your own configuration values.
Open the application.properties file and add the following values:
# Change with your values quarkus.container-image.group=lordofthejars quarkus.container-image.registry=quay.io quarkus.container-image.tag=1.0.0By default, Quarkus maps the extra endpoints, like the metrics one, to the /q subpath, so to get the metrics, you should query the /q/metrics endpoint. Because Prometheus expects the metrics published in /metrics by default, let’s reconfigure Quarkus not to use the subpath:
quarkus.http.non-application-root-path=/Now you can build, containerize, and publish the application. Again, you can skip this step if you like, as an image is available at https://quay.io/lordofthejars/quarkus-monitor:1.0.0.
Kubernitize
It’s time to create a Kubernetes deployment file for this application. Create a deployment.yamlfile with the following content:
--- apiVersion: v1 kind: Service metadata: annotations: app.quarkus.io/build-timestamp: 2023-06-30 - 12:45:38 +0000 prometheus.io/scrape: "true" prometheus.io/path: /metrics prometheus.io/port: "8080" prometheus.io/scheme: http labels: app: monitor app.kubernetes.io/name: quarkus-monitor name: quarkus-monitor spec: ports: - name: http port: 8080 protocol: TCP targetPort: 8080 selector: app: monitor app.kubernetes.io/name: quarkus-monitor type: ClusterIP --- apiVersion: apps/v1 kind: Deployment metadata: annotations: app.quarkus.io/build-timestamp: 2023-06-30 - 12:45:38 +0000 prometheus.io/scrape: "true" prometheus.io/path: /metrics prometheus.io/port: "8080" prometheus.io/scheme: http labels: app.kubernetes.io/name: quarkus-monitor app: monitor name: quarkus-monitor spec: replicas: 1 selector: matchLabels: app: monitor app.kubernetes.io/name: quarkus-monitor template: metadata: annotations: app.quarkus.io/build-timestamp: 2023-06-30 - 12:45:38 +0000 prometheus.io/scrape: "true" prometheus.io/path: /metrics prometheus.io/port: "8080" prometheus.io/scheme: http labels: app.kubernetes.io/name: quarkus-monitor app: monitor spec: containers: - env: - name: KUBERNETES_NAMESPACE valueFrom: fieldRef: fieldPath: metadata.namespace image: quay.io/lordofthejars/quarkus-monitor:1.0.0 imagePullPolicy: Always name: quarkus-monitor ports: - containerPort: 8080 name: http protocol: TCPIt has nothing special except for the labels. As you’ll see later, we use labels to configure Prometheus, specify which services it should target, and expose the metrics in the /metrics endpoint. In this case, the app=monitor label is essential because every service containing this label will be targeted.
Congratulations. You have created your Quarkus application and configured it. Now it's time to work in the Developer Sandbox and deploy a Prometheus instance.
