7
$\begingroup$

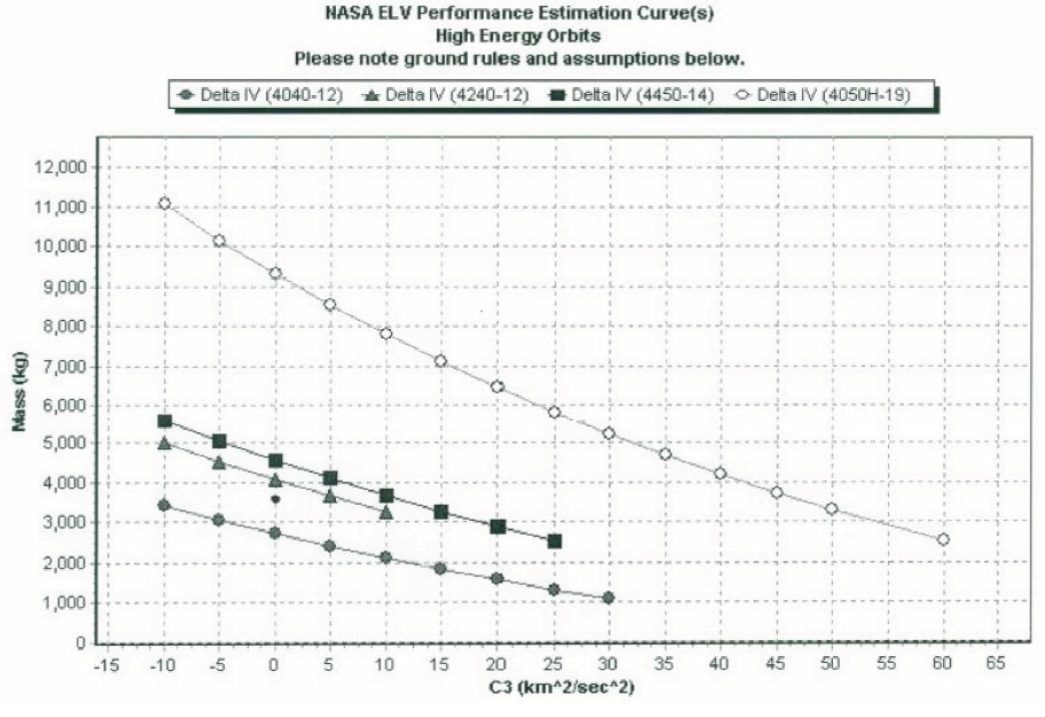
Following my previous question about Ariane 5 performance data for escape missions, I would like to know how the plot of launch vehicle capabilities like the next one are obtained:

Capabilities of various Delta IV launchers

More specifically, I would like to know how I can generate an approximation of these curves by using discrete data like the payload mass for a given C3.

My first idea was to use the rocket equation, but there is a lot of unknowns and the assumption that there are no external forces is clearly not respected for low altitudes.

My questions come down to:

  • What model can I use to generate such a curve?
  • What data are needed?
$\endgroup$
2
  • $\begingroup$Simplest would be to plot individual but similar mission profiles as discrete data points, then use curve fitting to extrapolate beyond input range. Most data analysis tools come with curve fitting algorithms.$\endgroup$CommentedNov 3, 2015 at 14:59
  • $\begingroup$Good idea bu the problem is that there is not a lot of data. For example, Ariane 5 only achieved one direct extraplanetary launch (Rosetta), and there are two other examples in the Ariane manual. However, each of these is for different configurations. This is one of the reasons I would like a model.$\endgroup$
    – Tonio
    CommentedNov 4, 2015 at 10:40

3 Answers 3

2
$\begingroup$

Despite @AdamWuerl's sage advice, I'll give it a go.

I'll do a single-stage, massless rocket body where mass is only propellant and payload as a zeroth-order spherical-cow attempt. If you needed better agreement, you'll have to model the staging and the boosters more faithfully.

$$v = v_{ex} \log(m_0/m)$$

inverts to

$$m = m_0 * \exp(-v/v_{ex}).$$

Let's say that $C_3$ is the excess $v^2$ above escape velocity from Earth:

$$C_3 = v^2 - v_{esc}^2,$$

$$v^2 = C_3 + v_{esc}^2,$$

so:

$$m = m_0 * \exp\left(-\sqrt{\frac{C_e + v_{esc}^2}{v_{ex}^2}}\right).$$

Your plot show the Delta IV(4450-14) has a payload mass of 4,500 kg at $C_3$=0. If you plug that convenient $C_3=0$ point into:

$$m_0 = m * \exp\left( \frac{v_{esc}}{v_{ex}} \right)$$

and use an exhaust velocity of 2.4 km/s (from Wikipedia), you get:

$$m_0 = 4,600 kg * \exp\left( \frac{11.2 km/s}{2.4 km/s} \right)$$

or about 489,000 kg, which is roughly right. The article puts various versions between 250,000 and 733,000 kg.

Putting $C_3$ = 25 km/s back into:

$$m = m_0 * \exp\left(-\sqrt{\frac{C_3 + v_{esc}^2}{v_{ex}^2}}\right).$$

gives $m$ = 2951 kg, which is roughly the 2500 kg shown in your plot.

So within the constraints of a single-stage, massless rocket body where mass is only propellant and payload, this is how you might do it. If you needed better agreement, you'll have to model the staging and the boosters more faithfully.

rocket wow

enter image description here

$\endgroup$
    4
    $\begingroup$

    These plots are best made using a trajectory optimization program like POST or OTIS, which is used to model the LV to some appropriate level of fidelity. Jacks-or-better is engine performance, some simple aerodynamic tables, operational constraints like max dynamic pressure, angle-of-attack limits, and fairing separation conditions, and of course the mass properties of each stage to modeling staging events. Each point on the C3 curve is a separate run of this software targeting the specified escape energy. To achieve more velocity payload must be offloaded, eventually the point where there's no left, just a payload less upper stage.

    Unfortunately these tools take quite a bit of expertise to run, and are also export controlled, but if you have a copy the necessary data is generally available or inferable.

    Important factors that influence the magnitude and the shape of the curve are the overall size of the LV (the SLS line is higher than the Falcon 9 line), the number of stages (3-stage vehicles tend to h

    $\endgroup$
    3
    • $\begingroup$Can you address "More specifically, I would like to know how I can generate an approximation of these curves by using discrete data like the payload mass for a given C3." I think the OP is interested in some basic help on the underlying math behind making a plot like this, rather than running a sophisticated, export-regulated software package. For example, the rocket equation $v(m_p/m_0)$ is logarithmic. This one is flipped, with mass ratio on the vertical axis, vs "energy". Would it therefore be exponential in shape?$\endgroup$
      – uhoh
      CommentedMar 14, 2018 at 0:12
    • 1
      $\begingroup$Unfortunately, if you want the plot to be correct there is no way to do what the OP is asking. Even for rockets that are currently flying, the C3 curves have different shapes, they cross each other, and a rocket that has twice the performance for trans-lunar injection may be only marginally better at higher C3 values. The performance depends on the number of stages and staging approach, mass fractions of each stage, and engine performance of each stage. No shortcuts on this one.$\endgroup$CommentedMar 17, 2018 at 5:25
    • $\begingroup$Any thoughts? How to interpret and use characteristic energy C3 in this case?$\endgroup$
      – uhoh
      CommentedMar 19, 2018 at 3:21
    1
    $\begingroup$

    It is possible to model the launch vehicle, including staging, by assuming gravity, drag etc. losses are constant for each launch vehicle. Data about maximum payload for a specific orbit can be used to estimate the losses.

    To demonstrate the calculations, I will use the Falcon 9 as an example, as it is a simple 2-stage launcher. The calculations should work for any number of stages, but requires estimating core stage fuel burn when applied to launchers with boosters. This is because each separation event (and even each throttle change when using engines with different specific impulses, for the most accurate results), must be modeled as a separate stage when using the multi-stage rocket equation.

    Falcon 9 has a maximum payload of 22,800 kg to LEO. Including this payload, the 2nd stage has a dry mass of 26,800 kg and a wet mass of 134,300 kg, and a vacuum specific impulse of 348s. This gives it a $\Delta v$ of 5,502 m/s.

    To calculate the delta-v of the 1st stage, the mass of the 2nd stage and payload must be included, giving it a dry mass of 156,500 kg and a wet mass of 567,400 kg. Assuming an average specific impulse halfway between the sea level and vacuum values (297s), this gives a first stage $\Delta v$ of 3,753 m/s, for a total $\Delta v$ of 9,255 m/s.

    According to this answer, SpaceX's definition of LEO is 200x360 km. Using the vis-viva equation, the periapsis velocity can be determined to be 7,833 m/s. The losses involved in the launch can be calculated by subtracting the periapsis velocity from the delta-v, giving 1422 m/s of losses.

    The accuracy of the constant loss assumption can be tested by using another data point. The GTO payload of Falcon 9 is 8,300 kg. Repeating the same calculations as for LEO gives a $\Delta v$ of 11,731 m/s, and a velocity of 10,242 m/s at 200 km. This gives losses of 1,489 m/s, which is fairly close to the LEO value. Since C3 > 0 is even higher energy than GTO, the GTO losses are probably more representative than the LEO losses. Therefore, the velocity at 200 km will be assumed to be $\Delta v - 1489$ m/s.

    The next step is converting the velocity at 200 km into a C3 value, using the formula $C3 = v^2 - v_e^2$, where $v_e$ is the escape velocity (11,012 m/s at 200 km). The C3 can then be plotted for a range of payload values to obtain a graph. Calculating the C3 manually for a suitable number of payload values is tedious, so I have made a script to automate this process.

    This produces the following graph: Plot of Falcon 9 C3 vs Payload

    $\endgroup$

      Start asking to get answers

      Find the answer to your question by asking.

      Ask question

      Explore related questions

      See similar questions with these tags.