A Brief History of Web Mapping
24 likes16,310 views

A lecture that I gave on 17th March 2010 at the University of Nottingham on the History of Web Mapping. Starts with some early history and then tracks the interplay of technology, business and usage in the development of web mapping over the last 2 decades. Based on a series of interviews with key players in the UK and US, this is a work in progress. There is still quite a lot more needed to complete this. Some useful resources are linked to in the penultimate slide. The mind map that I used to build this talk is at http://bit.ly/HistoryWebMap


![[공간정보시스템 개론] L07 원격탐사의 개념과 활용](https://cdn.slidesharecdn.com/ss_thumbnails/l07-170314114620-thumbnail.jpg?width=560&fit=bounds)


![[공간정보시스템 개론] L06 GIS의 이해](https://cdn.slidesharecdn.com/ss_thumbnails/l06gis-170314114559-thumbnail.jpg?width=560&fit=bounds)


More Related Content
What's hot (20)
Viewers also liked (15)


Similar to A Brief History of Web Mapping (20)


More from Steven Feldman (20)


Recently uploaded (20)


A Brief History of Web Mapping
- 1. The History of Web Mapping Steven Feldman http://flic.kr/p/6GMqs
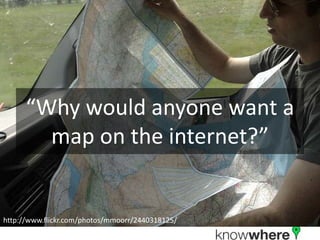
- 3. “Why would anyone want a map on the internet?” http://www.flickr.com/photos/mmoorr/2440318125/
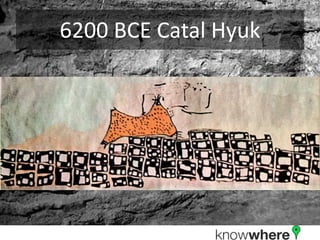
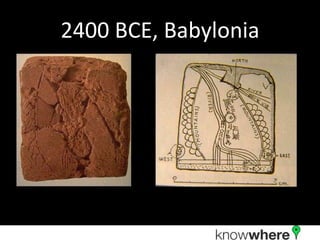
- 5. 6200 BCE Catal Hyuk
- 7. 600-350 BCE, Pythagoras & Aristotle http://en.wikipedia.org/wiki/File:Kapitolinisch http://en.wikipedia.org/wiki/File:Aristotle_Alte er_Pythagoras_adjusted.jpg mps_Inv8575.jpg
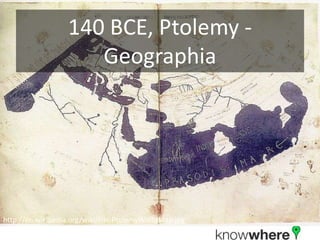
- 8. 140 BCE, Ptolemy - Geographia http://en.wikipedia.org/wiki/File:PtolemyWorldMap.jpg
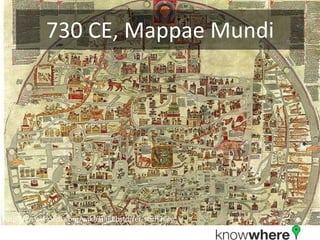
- 9. 730 CE, Mappae Mundi http://en.wikipedia.org/wiki/File:Ebstorfer-stich2.jpg
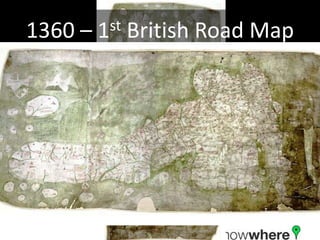
- 10. 1360 – 1st British Road Map
- 11. 1440 - Gutenberg
- 12. 1569 – Mercator publishes 1 st world map
- 13. Skip to 1980’s
- 14. Heroes, visionaries and some missed opportunities
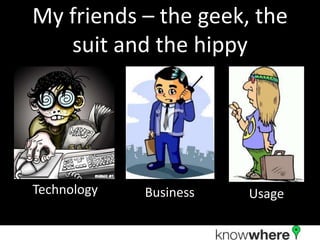
- 15. My friends – the geek, the suit and the hippy Technology Business Usage
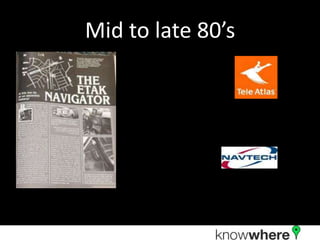
- 16. Mid to late 80’s
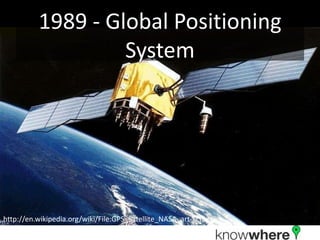
- 17. 1989 - Global Positioning System http://en.wikipedia.org/wiki/File:GPS_Satellite_NASA_art-iif.jpg
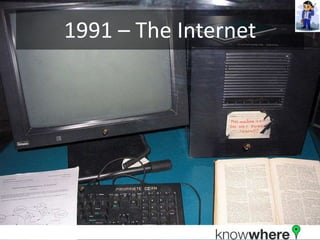
- 18. 1991 – The Internet
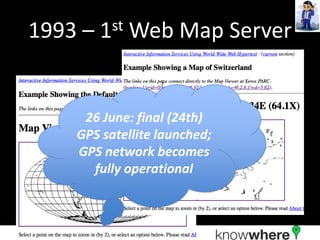
- 19. 1993 – 1st Web Map Server 26 June: final (24th) GPS satellite launched; GPS network becomes fully operational
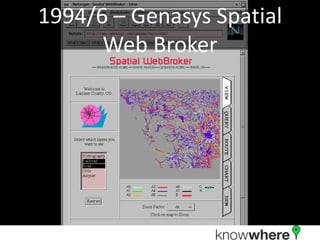
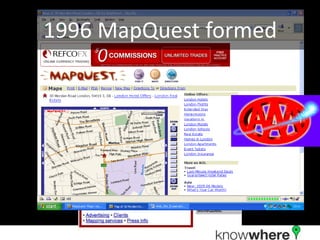
- 20. 1994/6 – Genasys Spatial Web Broker
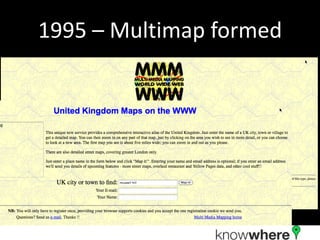
- 21. 1995 – Multimap formed
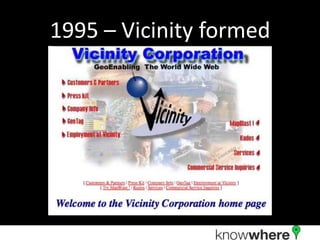
- 22. 1995 – Vicinity formed
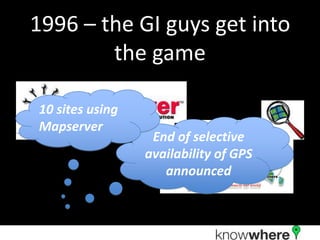
- 24. 1996 – the GI guys get into the game 10 sites using Mapserver End of selective availability of GPS announced
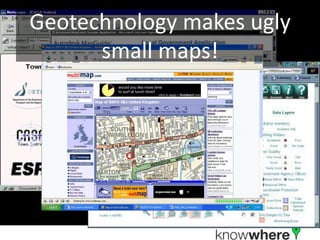
- 25. Geotechnology makes ugly small maps!
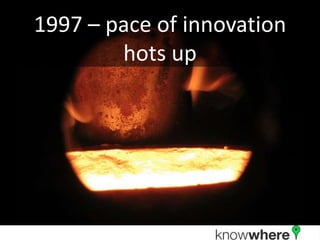
- 26. 1997 – pace of innovation hots up
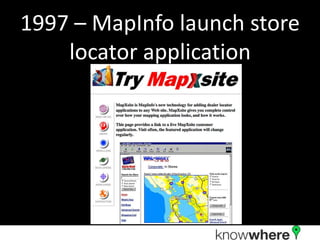
- 27. 1997 – MapInfo launch store locator application
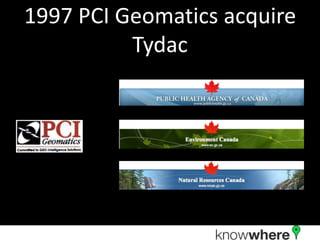
- 28. 1997 PCI Geomatics acquire Tydac
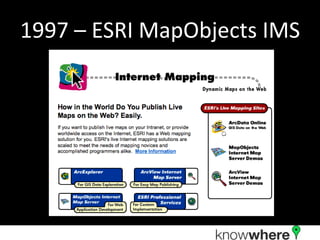
- 29. 1997 – ESRI MapObjects IMS
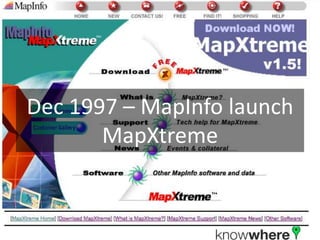
- 30. Dec 1997 – MapInfo launch MapXtreme
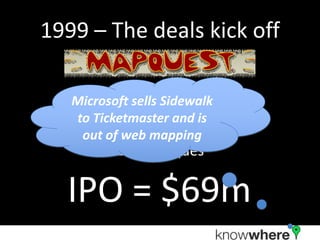
- 31. 1999 – The deals kick off Microsoft sells Sidewalk Feb ’99 – 76m maps to Ticketmaster and is 14m routes out of web mapping 2.7m uniques IPO = $69m
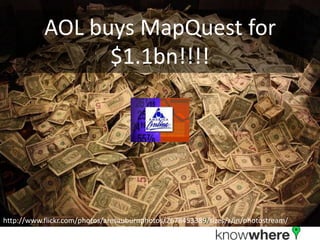
- 32. AOL buys MapQuest for $1.1bn!!!! http://www.flickr.com/photos/aresauburnphotos/2678453389/sizes/z/in/photostream/
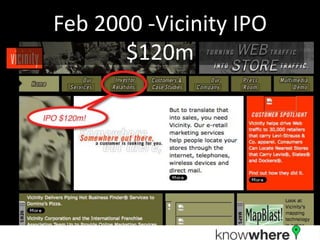
- 33. Feb 2000 -Vicinity IPO $120m
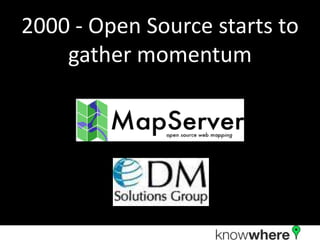
- 34. 2000 - Open Source starts to gather momentum
- 35. May 2000 – End of “selective availability” of GPS
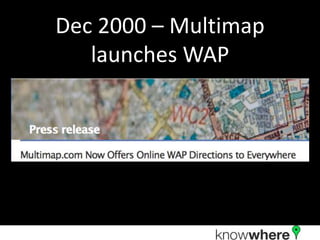
- 36. Dec 2000 – Multimap launches WAP
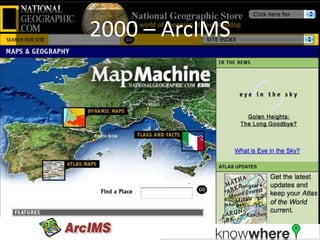
- 37. 2000 – ArcIMS
- 38. 2002 Dot Com Madness
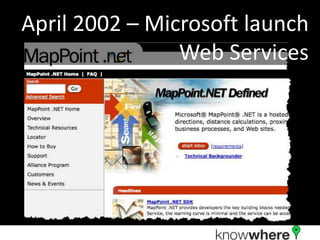
- 39. April 2002 – Microsoft launch Web Services
- 40. Oct 2002 – Microsoft acquires Vicinity for $96m http://www.flickr.com/photos/medd ygarnet/2794608347/
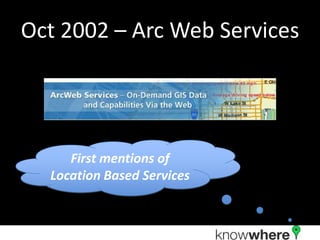
- 41. Oct 2002 – Arc Web Services First mentions of Location Based Services
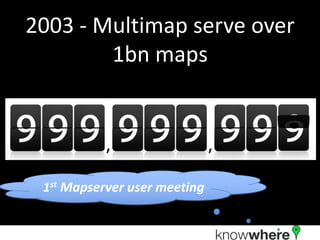
- 42. 2003 - Multimap serve over 1bn maps 1st Mapserver user meeting
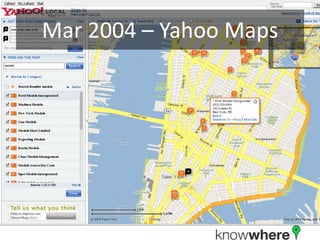
- 43. Mar 2004 – Yahoo Maps
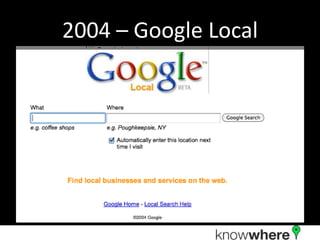
- 44. 2004 – Google Local
- 45. 2004 – more people use maps online than e-mail
- 46. Aug 2004 – OpenStreetMap conceived
- 47. Oct 2004 – Mapsearch.ch
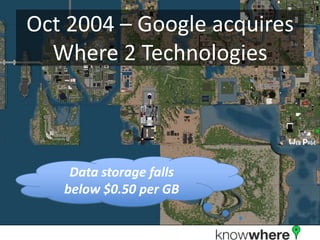
- 48. Oct 2004 – Google acquires Where 2 Technologies Data storage falls below $0.50 per GB
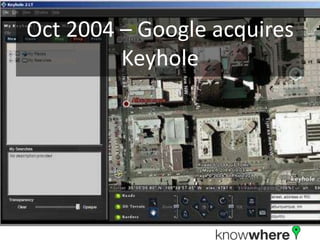
- 49. Oct 2004 – Google acquires Keyhole
- 50. 2004 – ESRI & MapInfo Service Oriented Architectures
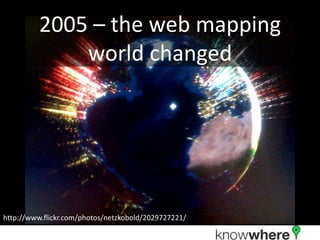
- 51. 2005 – the web mapping world changed http://www.flickr.com/photos/netzkobold/2029727221/
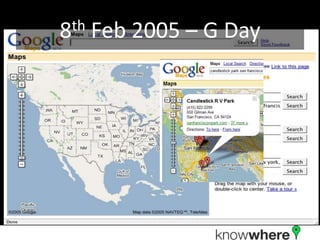
- 52. 8th Feb 2005 – G Day
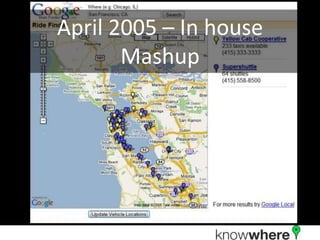
- 53. April 2005 – In house Mashup
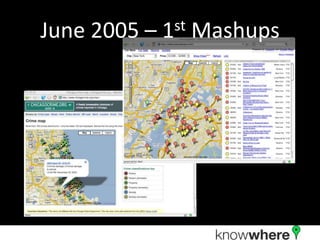
- 54. June 2005 – 1st Mashups
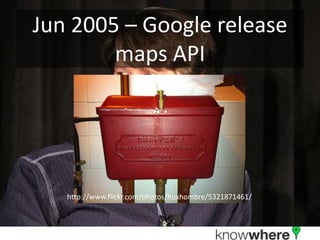
- 56. Jun 2005 – Google release maps API http://www.flickr.com/photos/huxhombre/5321871461/
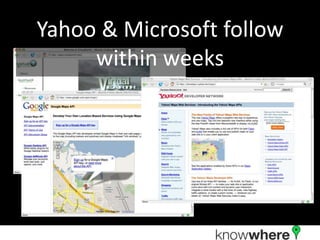
- 57. Yahoo & Microsoft follow within weeks
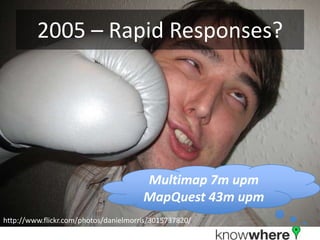
- 58. 2005 – Rapid Responses? Multimap 7m upm MapQuest 43m upm http://www.flickr.com/photos/danielmorris/3015737820/
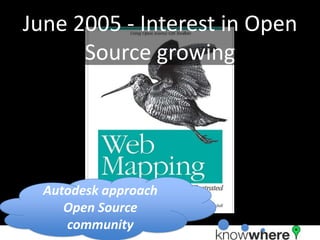
- 59. June 2005 - Interest in Open Source growing Autodesk approach Open Source community
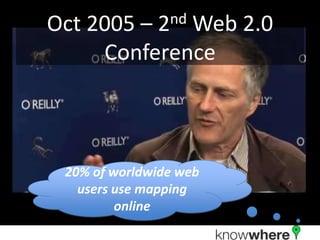
- 60. Oct 2005 – 2nd Web 2.0 Conference 20% of worldwide web users use mapping online
- 61. 2006 – A year of open?
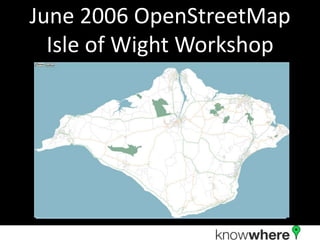
- 62. June 2006 OpenStreetMap Isle of Wight Workshop
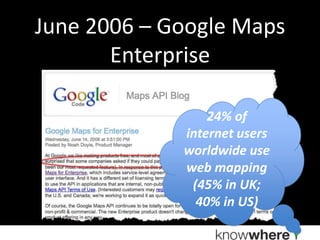
- 63. June 2006 – Google Maps Enterprise 24% of internet users worldwide use web mapping (45% in UK; 40% in US)
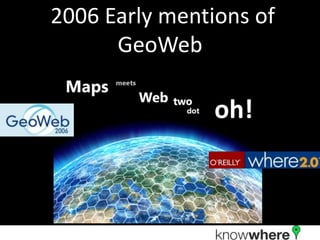
- 64. 2006 Early mentions of GeoWeb
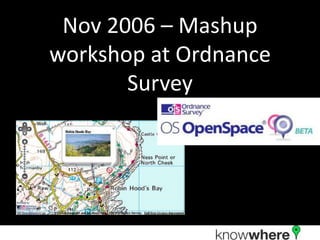
- 65. Nov 2006 – Mashup workshop at Ordnance Survey
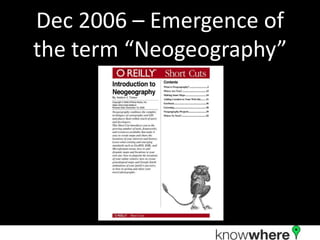
- 66. Dec 2006 – Emergence of the term “Neogeography”
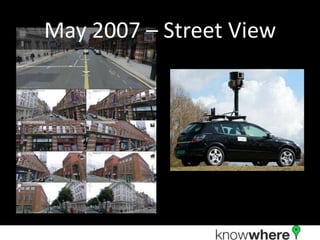
- 67. May 2007 – Street View
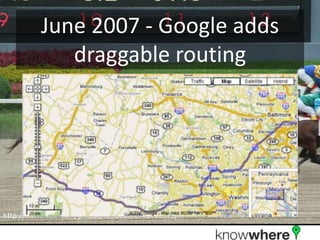
- 68. June 2007 - Google adds draggable routing http://www.flickr.com/photos/letsbook/2778790872/
- 69. July 2007 – 1st OpenStreetMap Conference
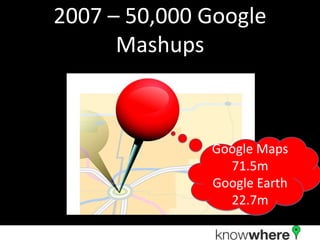
- 70. 2007 – 50,000 Google Mashups Google Maps 71.5m Google Earth 22.7m
- 71. 2008 – Playing catchup http://www.flickr.com/photos/b-tal/3419761761/
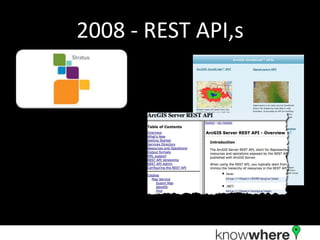
- 72. 2008 - REST API,s
- 73. 2008 – Google driving down costs http://www.flickr.com/photos/bitzcelt/4787422150/
- 74. 2008- The pace speeds ups http://www.flickr.com/photos/peterhodge/4655579584/
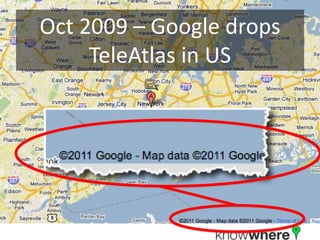
- 75. Oct 2009 – Google drops TeleAtlas in US
- 77. 2010 – Vectors back in fashion?
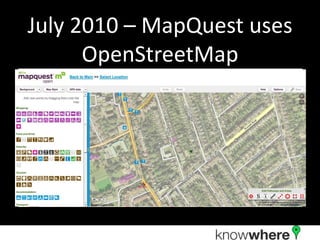
- 78. July 2010 – MapQuest uses OpenStreetMap
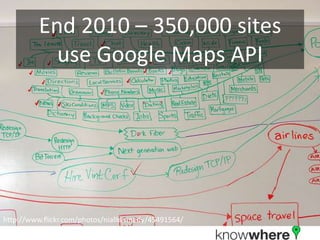
- 79. End 2010 – 350,000 sites use Google Maps API http://www.flickr.com/photos/niallkennedy/45491564/
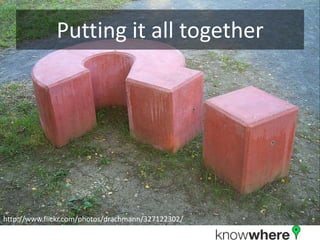
- 80. Putting it all together http://www.flickr.com/photos/drachmann/327122302/
- 83. Clash of Business Models http://www.flickr.com/photos/alexmasters/268526879/
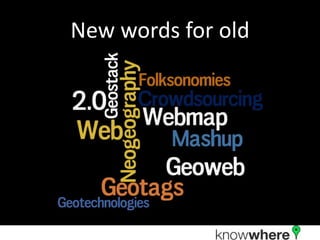
- 86. New words for old
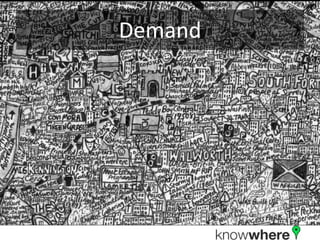
- 88. Demand
- 90. Thanks to Tom Myers, Product Manager, PBBI Dave McIlhagga, Anthony Pegg, MapQuest founder DM Solutions Ed Parsons, Geotechnologist, Google Sean Phelan & Audrey Mandela, founders of MultiMap Charles Kennelly, CTO ESRI UK Tyler Mitchell, Executive Director Web Mapping 2.0: The OSGeo Foundation Neogeography of the GeoWeb, Muki Haklay, Alex Singleton & Chris Parker
- 91. Mindmap, Notes & Resources http://bit.ly/HistoryWebMap Slides http://www.slideshare.net/stevenfeldm an/history-of-web-mapping
- 92. Steven Feldman steven@knowwhere.consulting.co.uk www.knowwhereconsulting.co.uk www.geo.me @stevenfeldman
Editor's Notes
- #2: Introduce yourself – personal history and why it meshes with the time frame of the presentationTry to be interactive, promise no bullet point slides, so sit back enjoy and stick your hand up whenever you want to comment or ask a questionContent divides into 4 phasesHistorians use dating like BCE and CE, we probably need to add BG and AGPre Web stuffEarly web maps pre GoogleGI vendorsPublic sitesPost Google web mappingWhat does it all mean?3 threads Tech, Business & Content/UsageInteractive part where you can help me to understand the content
- #3: A lot of research7 interviewsSeveral papersA fair bit of wikipediaThere is a link to a lot of my notes and content at the end of the presentationNeed to do more on the content stream, how content and usage has evolved over last 15 years
- #4: By chance I have been working in GI through most of the significant developments of web mappingI remember asking this question of the European VP of a GI business in 1998? He didn’t really have a good answer! Perhaps you will at the end of this lecture
- #5: Let’s start by looking back to the very beginnings of mapping
- #6: 16500 BCE Star Map in caves at Lascaux, France6200 BCE CatalHyük map, AnatoliaWall painting/carving depicting the positions of the streets and houses of the town together with surrounding features such as the volcano close to the townSome debate as to whether this is a mapClick to buildThink about the plan rather than elevation view
- #7: 2400 BCE Earliest known Babylonian mapA 7.6 × 6.8 cm clay tablet found in 1930 at Ga-Sur, near contemporary Kirkuk, shows a map of a river valley between two hills. Cuneiform inscriptions label the features on the map, including a plot of land described as 354 iku (12 hectares) that was owned by a person called Azala. Click to buildHills are shown by overlapping semicircles, rivers by lines, and cities by circles. The map also is marked to show the cardinal directions
- #8: 600 BCE Pythagoras - 350 BCE AristotlePythagoras proposed, and Aristotle put forward six arguments to prove, that the Earth is spherical250 BCE EratosthenesMeasured the circumference of the Earth; introduced a grid to locate positions of places
- #9: 140 BCE Ptolemy publishes Geographia - a Guide to GeographyDocumented basic principles of cartographyConsiders the problem of map projection, including two different projectionsMapped the known world giving coordinates of the major places in terms that are essentially latitude and longitude.
- #10: 730 – 1460 Mappae MundiThese maps show coastal details, mountains, rivers, cities, towns and provinces. Some include figures and stories from history, the Bible and classical mythology. Also shown on some maps are exotic plants, beasts and races known to Medieval scholars only through Roman and Greek texts.Prior to its destruction in World War II, the Ebstorf map at 3.5 metres (11 ft) across was the largest surviving mappa mundi. Today that honor is held by the Hereford map which is 1.5 metres (4.9 ft) across.
- #11: 1360 Gough Map – the 1st British Road MapThe Gough Map is the oldest extant map of the roads of medieval Britain.It is about 115 x 56cm large and was made around 1360. It is named after Richard Gough, who donated the map to the Bodleian Library in 1809.Click to buildEast is on the top!
- #12: 1440 Gutenberg invents printing pressThe very first technological evolution of mapping was the ability to “mass” produce maps for publication and distributionOne of the factors associated with the end of the middle agesCan the internet be compared with the introduction of printing in terms of info distribution?
- #13: 1569 Mercator publishes 1st world mapThe golden age of Dutch cartography. One of the first “mass produced” maps!Flemish geographer and cartographer Gerardus Mercator’s world map of 1569 introduced a cylindrical map projection that became the standard map projection known as the Mercator projection. It was a large planisphere measuring 202 by 124 cm, printed in eighteen separate sheets.The name and explanations given by Mercator to his world map (Nova et Aucta Orbis Terrae Descriptio ad Usum Navigatium Emendate: "new and augmented description of Earth corrected for the use of navigation") show that it was expressly conceived for the use of marine navigation.
- #15: The history of web mapping is a story of some visionaries even heroes and of several missed opportunitiesLike all histories it is a story of people, events, happenstance and surprises.Any ideas who this guy is?
- #16: These 3 guys represent the 3 streams that I want to follow through the last 2 decades as we look at how web mapping developed.Look out for them
- #17: 1984TeleAtlas formed in Netherlands1985Navtech formed in Silicon Valley1st in car navigation systems ETAK and TeleAtlas
- #18: 1989 GPS rollout starts Late 1980's - early 90's early hacks of ArcView using CGI scripts“Over 5 years waiting for the vendors to deliver "proper" solutions”
- #19: 19911st web site onlineSir TBL’s computer acting as the first internet server!
- #20: 1993 1st Web Map Server Palo Alto Research CentreGenerally considered to be the first web map server, static maps served upXerox PARC Map Viewer was one of the earliest static web mapping sites, developed by Steve Putz in June 1993 at Xerox Corporation's Palo Alto Research Center (PARC). The Xerox PARC Map Viewer was an experiment in providing interactive information retrieval, rather than access to just static files, on the World Wide Web (Putz 1994).Map Viewer used a customized CGI server module written in Perl. Map images were generated in GIF format from two server side programs. MAP-WRITER created the raster images from the geographic database and RASTOGIF would convert the raster image into the GIF format.Xerox has long since discontinued the Map Viewer serviceLongitude, latitude & scale/zoom factor in URL query termsThe Map Viewer was presented in May 1994 at the First International World-Wide Web ConferenceLimited functionality & slow cycle of click & response“The interaction between the user and the map was implemented by a computer code (a Common Gateway Interface or CGI script), which ran on the Web server. Each time the user clicked on one of the links on the page, the user’s Web browser sent a request to the server. The request encoded in it the coordinates of the area that the user was interested in and other options such as the layers that were to be displayed. Once the server received the request, it would execute the CGI script, which would produce the HTML page and the associated imagefile that presented the new map, and then transfer these files over the Internet to the user’s computer. Once the files were received, the user’s browser would render them and show them on the computer’s screen.This interaction mode led to a delay of a few seconds between the user’s action (the click on the map) and the rendering of the map on the screen, with a visible refresh of the whole browser window when the new page was downloaded.This interaction model was the core of most of the Web mapping applications for the next decade.” – Haklay et alClick to build
- #21: Genasys start development of web brokerDevelopment of Genasys Spatial Web Broker capability began in 1994 and was officially announced in 1996. This product was designed to allow any web developer to integrate GIS functions, such as routing, into portal applications, e-government applications, and e-business applications.
- #22: Click to buildThis was the input screen on the very first Multimap UK site
- #24: MapQuestSubsidiary of R O’Donelly producing maps for inclusion in Blue Pages (local info at the front of telephone directories)GeoLocateSoftware to produce digital mapsIdentified potential of software to meet needs of other businessesGeocodeRouteRenderCreated CD Rom apps1996 1st MQ web service"Not a GIS" Location Based ServiceGeocoding, routing & presentationBuilt CGI web interface over GeoLocate1st commercial web map applicationVector to raster in browserConnect & interconnectPut maps and other content on customers' web sitesDataNavteq, GDT, AND, MQ own contentClick for example of early MQ mapsClick again1996 Automobile Association of America are very early MQ customerTriptix service - call an operator, give them your route request. Printed maps, itinerary and things to see/stay posted
- #25: “Early offers from MapInfo & Esri were desktop products running on server” – EPIn 2000 Dauman (Malaysia) wrote “A few commercial product can be used to develop interesting interfaces such as ArcView Internet Map Server by ESRl, Grasslinks by University ofCalifornia, MapInfo ProServer by Maplnfo and Spatial WebBroker [3]. But, there's a drawback, which involves a very high cost, and it will slow down any process if the demand repeated. As a solution, the use of Map Applet [6] can overcome these high cost problems for interactive presentation of GIS data on web. However, a new problem occurs on how to perform data compression to make it smaller and speed up the transmission process.”1996 ESRI UK Intra Active Maps“Based on Map Objects IMS and designed to provide local authorities with intranet facility to be used in the front office.Datasets in Shapefile format could be accessed and what we would now call “mashed up” to allow LA staff to see anything spatial from planning application boundaries in a windows-like interface, where themes could be turned on and off through a table of contents.Brainchild of Roy Laming with realisation by Consultancy Services – Matt Toon, now at Google was the development lead. From memory we sold 3 licenses before we withdrew the product. It did however allow us to “cut our teeth” on issues of web mapping which came to fruition in a much more profitable way in NLIS Searchflow which used MO Java to do the first commercial-scale polygon editing on the web of which I am aware. ESRI (UK) wrote the editing tools from scratch – ESRI inc used many of the ideas in ArcIMS.’’ - A Coote1996 ArcView IMS extensionArcView 3.0 running on server with scriptingWith the ArcView Internet Map Server extension, you can use ArcView GIS out-of-the-box to put mapping and GIS applications on the Internet. ArcView Internet Map Server makes publishing maps on the Web almost as easy as printing a map. It includes a built-in setup wizard and ready-to-use Java applet to help you publish your data quickly. Interactive maps can be created from a number of different types of spatial data including shapefiles, coverages, SDE layers, DWG, DXF, DGN, and a variety of graphic images. 1996 - MI ProServerA typical installation of MapInfo ProServer, which includes MapInfo Professional, MapBasic, and a range of data and sample applications, is approximately $25,000. MapMarker 2.1 is available separately.Early pricing $59,500 unlimited usage! Vendors tried to apply desktop pricing to web applications!Click – GPS announcement onlyStart of Open Source mapping, just as big guys are getting into the game the Open source community are nibbling
- #26: Vector to raster conversion on server is processor intensive and slow. Gets worse as images get largerClickBandwidth means getting image to browser was very tedious, usually image was larger than all other content on pageHence small mapsClickStock cartography and in the UK dominance of OS maps made ugly mapsClickEven Multimap used this technology back in the day, though they made a better job of it than some of the so called professionalsInteraction was slow, functionality limited because browsers were pretty dumb. Surprising anyone wanted to use these services on a dial up connection!
- #27: This is where the big GI vendors start to get into the web mapping business
- #28: 1st out of the traps 97 - MapXsiteDedicated app for store locatorsCut down pricing
- #29: 1997 PCI GeomaticsAcquired TydacScripted SPANS1st contract Health Canada Notifiable Diseases (still live) (link)Subsequently Environment Canada & Natural Resources Canada
- #30: 1997 MapObjects IMS became 2000 ArcIMSBuilt on ArcObjectsSeparate from all other ESRI codebaseAll new codeScalable and performantVery important release for ESRI
- #31: 1997 MapXtremeMap rendering and search, not much advanced spatialBrokered technology shares MapX instances for complex functionality or pooled for simple high volume appsProprietary scripting language bundled HAHTsite
- #32: Skip a year to 1999The only important thing that happened in 98 was that I got into GIMay: Mapquest IPO raises $69M“MapQuest is a leading online provider of mapping and destination information. By effectively employing its over 30 years of traditional and digital mapping experience together with its proprietary integration and editing of geographic databases, MapQuest provides comprehensive online mapping solutions to businesses and provides customized maps, destination information and driving directions to consumers. During February 1999, MapQuest delivered over 76.2 million maps and over 14.2 million driving directions through its own website and through third-party websites. According to Media Metrix, Inc., in February 1999 mapquest.com had over 2.7 million unique visitors, making it the number five travel/tourism Internet property in terms of audience reach.”Click to buildJuly: Microsoft sells sidewalk to Ticketmaster; is out of web mappingWe’ll see Microsoft doing the web mapping hokey cokey for the next few years
- #33: Dec 1999 AOL purchase MQ for £1.1Bn! That’s £1,031m increase in less than a year. Dot com madnessBusiness largely based on cashflow from B2BConsumer web site losing moneyAOL drive advertising, then whooosh!
- #34: Feb: Vicinity IPO:Raised $120MPeaked to market cap of $2bn, before dropping 25%Trading at 160x revenues, was losing $1M/month at the timeNote the investor relations link on the front page of their web site.
- #35: 4 components to stimulate adoption of OS web mapping in placeOS Operating SystemOS Web Map ServersPrograming LibrariesESRI shape & coverage files, Microstation design files, MapInfo Tab etcAllows source data in original formatGDALOGR
- #36: GPS now becomes widespread in consumer devices
- #37: MultiMap Launch WAP, PDA services, Tele Atlas street-level maps, Travel directions, Aerial photos, tube maps“WAP phone users will have easy access to live interactive information services. They can access the site via their browsers and make use of the Travel Directions facility and Multimap.com's Store Finder service. “Not web mapping but interesting none the less – everyone talking mobile but it isn’t going to happen for another 7 or 8 years. Inhibitors are bandwidth, battery, applications
- #38: ArcIMS rebranded from ArcObjects IMS major new release powers many government web portals in UK and USMy company GDC started building intranet GIS for Local Government on top of MapInfo tech
- #39: Dot com madnessSubsequent developments exposed some of the bonkers thinking within the dot com world of 2000-2002Data licensors had completely distorted sense of the value of base maps.Consider the ludicrous prices paid for 3g licenses in UKMost internet mapping start-ups have gone out of businessI was working at whereonearth (subsequently bought by Yahoo) at the time. We bought GDC, a 1.6m turnover business out of WoE for a song because it wasn’t sexy and they were running out of cash
- #40: July: launch of Microsoft MapPoint web serviceAnother Microsoft mapping venture (I think this got closed down later on)
- #41: October: Microsoft acquires Vicinity for $96 million in cash !!Vicinity had over $80 million in the bank, proceedings from its IPO“Our combined strengths will put us in a better position to deliver the benefits of location in the widest range of enterprise and consumer applications," said Ted Johnson, Corporate Vice President at Microsoft. ….. This acquisition will accelerate the adoption of location-based technology as a valuable ingredient of mainstream enterprise application development. And by enlarging our scope to encompass a .NET infrastructure, we can offer customers a broader variety of contexts in which location-based technology is deployed.”Click to build Pouring money down the drain or a great deal?
- #42: ArcWeb ServicesEarly SaaS offerNever profitable, closed 2009Too early?
- #43: Cumulative!Click to build2003 MapServer User meetingCommunitySructure2003-4 MapServer40% of MS code written by DMS & their contractorsPart funded by customer lead requirements
- #44: Not many people realise that Yahoo were the first people to launchslippy maps and integration with searchNeed to get an interview with some of the early Yahoo maps team if there are any of them left
- #45: Searched local listings and then presented results on a map2003-5 Google used MapQuestToo costly?
- #46: Pew Internet & American Life Project surveyAugust: US research describes mapping as “most popular online activity”email/chat was #2 - source: Pew Internet & American Life Project survey
- #47: August: Steve Coast presented ideas for OpenStreetmap at EuroFOO
- #49: Oct 2004 - Google acquires where 2 technologies from Lars & Jens Rasmussen (link)Tile server feeding tiles to a desktop clientEarly use of asynchronousCombination of asynch and tiles and more standardisedjavascript creates conditions for first Google maps deploymentCached tiles plus AJAX in the browser are a game changer, performance, cartographyHow many servers?What tools for cartography?Click to build2004 storage costs <$0.50/GB (link)Today costs < $0.05/GB!
- #50: 2004 Google Acquires Keyhole2005 launches Google Earth
- #51: June 2004 Envinsa"Before its time""solved important problems"SOA influencedEvolved from early Open LS specs deployed for VodafoneAdded routing & geocoding to mappingIncorporated dataDec 2004 ArcGIS ServerToo complexFull GI Functionality of desktop productsDesktop on the web, all the power and complexityDidn't scale or perform
- #52: Usage of web mapping was limited by complexity, cost & poor user interaction“In summary, until about 2005, delivery of geographic information and GIS capabilities over the Internet was possible and increasingly more sophisticated but a combination of factors limited their use. Developing an Internet-based mapping application remained complex, and this limited the number of developers and kept the cost of Web mapping high. Importantly, as most of these Internet mapping applications rely on some background cartography, this required purchasing expensive background maps outside the USA, or, even where public domain geographic information are available (USA), a significant knowledge in manipulating these datasets and preparing them for delivery is required.Finally, from an end user perspective, the delivery of geographic information in a graphical form was limited due to network bandwidth, especially as when these standards were first introduced many users were still using dial-up links to the Internet.” - Haklay et al
- #53: Feb 2005 1st Google Maps service launchesI love the “we think maps can be fun and useful” bitInitially USJuly 2005 JapanLate 2005 cover extends to CanadaEarly 2006 UK & JapanGoogle Earth imagery addedClick to build and show early maps
- #54: 1st App was a Google built Ride Sharing app
- #56: Google tech being used in a way they did not foreseePayaways to data licensees mean that mashups cost google moneyWhat should they do?
- #57: Making the API freely available John Hanke (ex Keyhole) made decisionGoogle needs the internet to growMore content to indexMore space to place advertsBrand recognitionClick to buildYou might wonder what the free maps API would do to the established technology and mapping businesses? I am not sure that they took it too seriously to start with
- #59: Up to 2005 Thousands of business customers paying MQ on a transaction basis'All of a sudden it's free and easy to use’MultiMap switch from in house platform to deCartaPrimary tech drivers were around achieving reliability (99.95% uptime) combined with high throughput.In the last months before moving to tiled, draggable maps we were serving up to 10 million map deliveries a day and we had tough SLAs with our clientsMapInfo and ESRI say “It’s not proper GIS”Click to build
- #60: 2005 DM losing customers to GoogleOpened eyes to importance of business model and valueLeadership in open source did not translate to business successIncreased competition as technology maturedNot thinking about customer pain points and sales processClick to buildEnd 2005 - DM discussing Open Source map businessGroup of developers on GDAL and OGR started cooperatingAutodesk offering some fundingAutodesk MapGuide Open Source2005 Autodesk approach re putting MapGuide into open source (link)Some concerns within community re branding MapServer Enterprise for MapGuideBecame the MapServer Community
- #61: 2005 O'Reilly publish "Web Mapping Illustrated”First O’Reilly Where 2.0 conference follows; emergence of “Maps 2.0” and beginnings of NeogeographyClick to build
- #62: 2006 OSGeo formedMapServerMapGuide OSOn Open Source "Pragmatic not political"Autodesk funded
- #63: May: Openstreetmap IOW workshop This was OSM for IoW before the weekend workshopClick to buildThis was it after a weekend, mapped!
- #64: June 2006Maps Enterprise API launchesNow the GI vendors really do have competition although they are still in denial!Click to build
- #65: Early mentions of GeoWeb(link)Some will refer to earlier technical papers dating back to 94 - Dr. Charles Herring in his US DoD paper, An Architecture of Cyberspace: Spatialization of the Internet, 1994New approaches to Geo Information distribution, usability & application development“... the change is not of increased functionality, rather how emerging technologies have created new approaches to geographic information distribution and, most impor- tantly, in the usability and ease of application development” - Haklay
- #66: OpenSpace demonstratedTook a year to release!
- #67: Emergence of the term Neogeography‘a socially networked mapping platform which makes it easy to find, create, share, and publish maps and places’ - Di-Ann Eisnor“Neogeography means ‘new geography’ and consists of a set of techniques and tools that fall outside the realm of traditional GIS, Geographic Information Systems. Where historically a professional cartographer might use ArcGIS, talk of Mercator versus Mollweide projections, and resolve land area disputes, a neogeographer uses a mapping API like Google Maps, talks about GPX versus KML, and geotags his photos to make a map of his summer vacation.Essentially, Neogeography is about people using and creating their own maps, on their own terms and by combining elements of an existing toolset.Neogeography is about sharing location information with friends and visitors, helping shape context, and conveying understanding through knowledge of place.Lastly, Neogeography is fun . . .” (Turner 2006, 2–3)Approach or mode of thought not a technology"this disregard to past practices is part of the zeitgeist that is central to Web Mapping 2.0." - Haklay et al
- #68: May 2007 Street View (link)Initially images sourced from Immersive Media but by end of 2007 Google capturing images with Google StreetView cars
- #69: 2007 Google RoutingOriginally TelcontarReplaced with Google own tech 1 year later"Underlying routing algorithms are not rocket science, but scaling it is" - EPA key Google contribution has been massive scaling of mapping infrastructureNote the pattern here, Google buys and then buildsOther vendors are left trailing in Google’s wake with this feature
- #71: Monthly users
- #72: Everyone is playing catchup in 2008 because this Google thing isn’t going to go away2008 MQ becomes only a service not available as installable software3 MQ versionsFreeRestrictions on data availableEnterpriseDeveloperMultiMap Open API launched
- #73: 2008 - StratusSlippy maps and RIA controlsMarket specific solutionLocal GovtInsuranceSaaS model2008 ArcGIS Server REST APIMost significant release to date on the webSimpler range of optionsEasier to programScalableBrowser holds state, server just returns responses
- #74: Google Base Data2008 TA contract negotiationsTough negotiations with TA prompted the desire to source maps on a licensing model that matched Google's own businessPattern emerging - need to keep costs under control (google has the muscle that almost no other entrant/customer has)Maps derived from Street ViewMap Maker Fills in coverage and gives royalty free contentCoverage where navigation databases don't goQA for Street View or other suppliersNew sourcesPerpetual, royalty free licenses
- #75: Just look at this for a year’s releases to Google Maps, difficult for the other players to keep up! 21 announcements in 1 year!On January 22, 2008, Google expanded the Local Onebox from 3 business listings to 10On February 20, 2008, Google Maps allowed searches to be refined by User Rating & neighborhoods.On March 18, 2008, Google allowed end users to edit business listings and add new places.On March 19, 2008, Google added unlimited category options in the Local Business Center.On April 2, 2008, Google added contour lines to the Terrain view.In April 2008, a button to view recent Saved Locations was added to the right of the search field.In May 2008, a "More" button was added alongside the "Map", "Satellite", and "Terrain" buttons, permitting access to geographically-related photos on Panoramio and articles on WikipediaOn May 15, 2008, Google Maps was ported to Flash and ActionScript 3 as a foundation for richer internet applications.On July 15, 2008, walking directions were added.On August 4, 2008, Street View launched in Japan and Australia.On August 15, 2008, the user interface was redesigned.On August 29, 2008, Google signed a deal under which GeoEye would supply them with imagery from a satellite and introduced the Map Maker tool for creation of map data.On September 9, 2008, a reverse business lookup feature was added.On September 23, 2008, information for the New York City Metropolitan Transit Authority was added.On October 7, 2008, GeoEye-1 took its first image, a bird's-eye view of Kutztown University in Pennsylvania.On October 26, 2008, reverse geocoding was added to the Maps API.On November 11, 2008, Street View in Spain, Italy, and France was introduced.On November 23, 2008, AIR support for the Maps API for Flash was added.On November 25, 2008, a new user interface for Street View was introduced.On November 27, 2008, maps, local business information, and local trends for China were introduced.On December 9, 2008, 2x Street View coverage was introducedEveryone else left reeling!
- #76: Click to buildNote the Map data copyright GoogleSome teething problemsNow rolling outto other countries
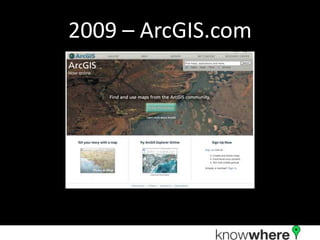
- #77: ArGIS.comCommunity GISAdapting to a commercial SaaS model
- #78: 2009 Google Tiles generated on the fly from vectorsCustom styling of map base introducedToday sending vectors to mobile apps running on Android OS
- #79: 2010 MQ Open Source & DataStart using OpenStreetMapCost is a driverOpen option in US, UK and GermanyClick to build to show UK mapQuality, will see how good is the crowdUsing OSM outside of the US and Europe as primary source of dataClick to build and show editing toolsOther open source packagesMapping is a known science, makes sense to share developmentTiles re-rendered every 10 minutesMicrosoft followsMicrosoft announce use of OSMSteve Coast joins Microsoft
- #80: Joke global domination whiteboard from Google offices
- #81: This is where you join inThoughtsExplosion of web mapping in 1st decade of 21stCTechnology enabled but colossal and perhaps unforeseen demand was unlockedUsability transformed when not driven by traditional GI interfacesTechnology came from advertising driven businesses not traditional GI vendorsBandwidth, data storage and GPS were key enablersWhat would have happened if John Hanke of Google had taken a different route re mashupsEarly maps - power, propaganda and art, new web maps – communication, propaganda and funPower transferred to users who become creatorsMaps no longer authoritativeTale of serendipity, missed opportunities and disruption
- #82: Look no bullet points!Most usage is very simple - where is & directionsOver 350,000 sites use the Maps API"Geography becomes mainstream if you make it cheap not premium"Echoes the spatial is not special mantra
- #83: Esri Drivers"Google was a kick up the arse!” – several others said the sameDefined User InterfaceEase of use, slippy maps, caching, AJAXPerformanceUIBig driver over last 7/8 years has been need to get costs down for truly enterprise deploymentsData was one of the main constraints on the evolution of the geoweb, now it isn'tOpenStreetMap“When all can potentially capture and distribute data through access to GPS, the Internet and mobile devices, what information can users trust? Another profound change is in the business models of data providers as, for many applications, data can be accessed freely either from voluntary sources or from commercial providers through their APIs. This can also have an impact on software vendors, at least in some WMS applications.” - Haklay et al
- #84: Google, Bing, MQ Business model is advertising basedKey driver is eyeballsPaid for B2B dealer locator market is gone. Destroyed by GoogleNow Google generating more revenue in Geospatial licensing than MapInfo!Proprietary vs Open (link)Need new pricing models to respond to pressuresIssue is not Intellectual Property, it's supportWho can you complain to?Who can you trust?
- #85: BandwidthGPSProcessing power of home PC’s allow massive advance in javascript capabilities within browserCheap disk spaceAJAXAPI'sMobile bandwidthBut the most important of all is CLICK Bandwidth
- #86: Google Technology (link)Early browsers were low functionality and were inconsistent in their implementation of javascriptHence the use of static map images and little or no interactivityEvolution of web mappingToday's challenges were the challenges of 40 years ago in delivering data and functionality to the terminal/desktop1968 Pre web mapping, challenge is to get content to desktop through slow networkIn the early days all data and processing on server returned to a dumb client terminal.Data and processing moved to desktop with PC's and ArcView type clientsThe data moved back to server but processing retained on desktopEnterprise file servers etcSimple browser apps transfer all processing and data back to the server, Browser is a dumb clientNow browser is a smart client with javascript processing power exceeding servers of 20 years ago3 Stages of web mapping complexityHaklay quoting and extending on Plewe 2007Public Mapping sitesMultimap, MapQuest, Yahoo, Google, BingContent controlled by providerPoints of interest, routingMap size limited by technology, slowPoor usability limited user engagement & interest to primary taskSpecialist apps built using web mapping serversEnvironment Agency, Local Government, specialised store locatorsOrganisations used their own contentGIS vendors web mapping techInteraction modes derived from professional desktop GISUsers needed to work hard to understand the applicationGeographic web servicesHigh end capabilities. Desktop in your browser!OGC standards
- #87: New languageGeoweb(link)The term ‘Geospatial Web’ implies the merging of geographic (location- based) information with the abstract information that currently dominates the Internet - Haklay et alNeogeographyTerm first coined by Di-Ann Eisnor 2006 MashupGeotagsCrowdsourcingGeostackFolksonomiesGeotechnologiesWeb 2.0“Web 2.0 is the business revolution in the computer industry caused by the move to the Internet as platform, and an attempt to understand the rules for success on that new platform.” (O’Reilly 2006)Web Mapping 2.0Goodchild 2007
- #88: “Today, of course, internet mapping services have evolved so that they are available through APIs that anyone can use to create a web-based application or mash-up showing whatever information they like on a map. And of course maps themselves are being made by members of the public with user-friendly tools. Individuals have gone from being simply the consumers of mapping services to the creators of the services and the maps themselves” Sean Phelan, founder of Multimap1993 Deep level tech skills needed to get the crudest map onto a web pageContinued through to 2005 to be the domain of specialists, who probably revelled in their special skill sets combining geo and dev2005 onwards geo becomes simpler and many more can deploy the capabilitiesToday even I can build a simple mashup and embed it into a web page, largely through a user interface and without needing to write any code.Good thing or bad thing?
- #89: Why has there been such an explosion of usage of web mapping?“In the early days content displayed on customers' maps was generally focused on their own businesses: properties for sale on estate agent maps; hotels on hotel providers' sites, etc. That has evolved such that today estate agents show schools, local transport, recreation facilities, aerial images, bird's eye images, etc. Hotels show transport, restaurants, bars, museums, etc. as well as the aerial and bird's eye imagery. Some sites also include user-generated content of various types, links to Wikipedia entries about landmarks. Today there appears to be no limit to the type of information that can and is displayed about a place.Internet mapping is not GIS. The GIS industry has historically focused on low-volume, functionally complex applications for professional users. Internet mapping is about delivering millions of map images, very fast at very low cost. The creative and aesthetic side of cartography has a long and rich history, which has largely been ignored by the digital mapping world. The general public expects maps to be intuitive and aesthetically pleasing, and have largely been disappointed with early digital products and online services. When users find maps they like, they return every day.” Sean Phelan, founder of Multimap
- #90: Esri Future TechMore, fasterNo barrier to delivery of functionalityChallenges are the interface and making complexity understandableVision to be invisible within larger enterprise systemsEsri Future BusinessMost to be onlineMove to SaaSPay for point functionalityUsers don't yet understand transaction based pricing modelsWill take time for them to convert current usage volumes into transactions (think electricity)ESRI ContentThink about the growth of functionality as contentDifferentiator will be presentation of functionalityCartographers more than techiesESRI UsersThings people need to do haven't really changed nor are they likely toUser numbers growing from thousands to 1bnFuture is in UIOpen SourceWeb mapping not be a specialist domainBlurring distinction between desktop and browserEasier start for new users
- #91: IntervieweesSean Phelan & Audrey Mandela, founders of MultiMap, 12 Jan 2011Charles Kennelly, CTO ESRI UK, 14 Feb 2011Tom Myers, Product Manager Web Mapping, PBBI 27th January 2011Ed Parsons, Geotechnologist, Google 26/1/10Anthony Pegg, MapQuest 15/02/11Tyler Mitchell, Executive Director OSGeo Foundation, 28 January 2011Dave McIlhagga, founder DM Solutions, 18/02/11Web Mapping 2.0: The Neogeography of the GeoWeb, MukiHaklay, Alex Singleton & Chris Parker (Very useful but perhaps overly UK centric)