Skip to main page content
U.S. flag

An official website of the United States government

Dot gov

The .gov means it’s official.
Federal government websites often end in .gov or .mil. Before sharing sensitive information, make sure you’re on a federal government site.

Https

The site is secure.
The https:// ensures that you are connecting to the official website and that any information you provide is encrypted and transmitted securely.

Access keysNCBI HomepageMyNCBI HomepageMain ContentMain Navigation
. 2021 Apr 2;19(4):e3000959.
doi: 10.1371/journal.pbio.3000959. eCollection 2021 Apr.

The evolving role of preprints in the dissemination of COVID-19 research and their impact on the science communication landscape

Affiliations

The evolving role of preprints in the dissemination of COVID-19 research and their impact on the science communication landscape

Nicholas Fraser et al. PLoS Biol..

Abstract

The world continues to face a life-threatening viral pandemic. The virus underlying the Coronavirus Disease 2019 (COVID-19), Severe Acute Respiratory Syndrome Coronavirus 2 (SARS-CoV-2), has caused over 98 million confirmed cases and 2.2 million deaths since January 2020. Although the most recent respiratory viral pandemic swept the globe only a decade ago, the way science operates and responds to current events has experienced a cultural shift in the interim. The scientific community has responded rapidly to the COVID-19 pandemic, releasing over 125,000 COVID-19-related scientific articles within 10 months of the first confirmed case, of which more than 30,000 were hosted by preprint servers. We focused our analysis on bioRxiv and medRxiv, 2 growing preprint servers for biomedical research, investigating the attributes of COVID-19 preprints, their access and usage rates, as well as characteristics of their propagation on online platforms. Our data provide evidence for increased scientific and public engagement with preprints related to COVID-19 (COVID-19 preprints are accessed more, cited more, and shared more on various online platforms than non-COVID-19 preprints), as well as changes in the use of preprints by journalists and policymakers. We also find evidence for changes in preprinting and publishing behaviour: COVID-19 preprints are shorter and reviewed faster. Our results highlight the unprecedented role of preprints and preprint servers in the dissemination of COVID-19 science and the impact of the pandemic on the scientific communication landscape.


Conflict of interest statement

I have read the journal’s policy and the authors of this manuscript have the following competing interests: JP is the executive director of ASAPbio, a non-profit organization promoting the productive use of preprints in the life sciences. GD is a bioRxiv Affiliate, part of a volunteer group of scientists that screen preprints deposited on the bioRxiv server. MP is the community manager for preLights, a non-profit preprint highlighting service. GD and JAC are contributors to preLights and ASAPBio fellows.

Figures
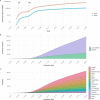
Fig 1
Fig 1. Development of COVID-19 and publication response from January 1 to October 31, 2020.
(A) Number of COVID-19 confirmed cases and reported deaths. Data are sourced from https://github.com/datasets/covid-19/, based on case and death data aggregated by the Johns Hopkins University Center for Systems Science and Engineering (https://systems.jhu.edu/). Vertical lines labelled (i) and (ii) refer to the date on which the WHO declared COVID-19 outbreak a Public Health Emergency of International Concern, and the date on which the WHO declared the COVID-19 outbreak to be a pandemic, respectively. (B) Cumulative growth of journal articles and preprints containing COVID-19–related search terms. (C) Cumulative growth of preprints containing COVID-19–related search terms, categorised by individual preprint servers. Journal article data in (B) are based upon data extracted from Dimensions (https://www.dimensions.ai; see Methods section for further details), and preprint data in (B) and (C) are based upon data gathered by Fraser and Kramer (2020). The data underlying this figure may be found in https://github.com/preprinting-a-pandemic/pandemic_preprints and https://zenodo.org/record/4587214#.YEN22Hmnx9A. COVID-19, Coronavirus Disease 2019; WHO, World Health Organization.
Fig 2
Fig 2. Comparison of the properties of COVID-19 and non-COVID-19 preprints deposited on bioRxiv and medRxiv between January 1 and October 31, 2020.
(A) Number of new preprints deposited per month. (B) Preprint screening time in days. (C) License type chosen by authors. (D) Number of versions per preprint. (E) Boxplot of preprint word counts, binned by posting month. (F) Boxplot of preprint reference counts, binned by posting month. Boxplot horizontal lines denote lower quartile, median, upper quartile, with whiskers extending to 1.5*IQR. All boxplots additionally show raw data values for individual preprints with added horizontal jitter for visibility. The data underlying this figure may be found in https://github.com/preprinting-a-pandemic/pandemic_preprints and https://zenodo.org/record/4587214#.YEN22Hmnx9A. COVID-19, Coronavirus Disease 2019.
Fig 3
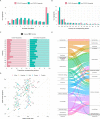
Fig 3. Properties of authors of COVID-19 and non-COVID-19 preprints deposited on bioRxiv and medRxiv between January 1 and October 31, 2020.
(A) Proportion of preprints with N authors. (B) Proportion of preprints deposited by country of corresponding author (top 15 countries by total preprint volume are shown). (C) Proportions of COVID-19 and non-COVID-19 corresponding authors from each of the top 15 countries shown in (B) that had previously posted a preprint (darker bar) or were posting a preprint for the first time (lighter bar). (D) Correlation between date of the first preprint originating from a country (according to the affiliation of the corresponding author) and the date of the first confirmed case from the same country for COVID-19 preprints. (E) Change in bioRxiv/medRxiv preprint posting category for COVID-19 preprint authors compared to their previous preprint (COVID-19 or non-COVID-19), for category combinations with n > = 5 authors. For all panels containing country information, labels refer to ISO 3166 character codes. The data underlying this figure may be found in https://github.com/preprinting-a-pandemic/pandemic_preprints and https://zenodo.org/record/4587214#.YEN22Hmnx9A. COVID-19, Coronavirus Disease 2019.
Fig 4
Fig 4. Publication outcomes of COVID-19 and non-COVID-19 preprints deposited on bioRxiv and medRxiv between January 1 and October 31, 2020.
(A) Percentage of COVID-19 versus non-COVID-19 preprints published in peer-reviewed journals, by preprint posting month. (B) Destination journals for COVID-19 preprints that were published within our analysis period. Shown are the top 10 journals by publication volume. (C) Distribution of the number of days between posting a preprint and subsequent journal publication for COVID-19 preprints (red), non-COVID-19 preprints posted during the same period (January to October 2020) (green), and non-COVID-19 preprints posted between January and December 2019 (grey). (D) Time from posting on bioRxiv or medRxiv to publication categorised by publisher. Shown are the top 10 publishers by publication volume. Boxplot horizontal lines denote lower quartile, median, upper quartile, with whiskers extending to 1.5*IQR. All boxplots additionally show raw data values for individual preprints with added horizontal jitter for visibility. The data underlying this figure may be found in https://github.com/preprinting-a-pandemic/pandemic_preprints and https://zenodo.org/record/4587214#.YEN22Hmnx9A. COVID-19, Coronavirus Disease 2019.
Fig 5
Fig 5. Access statistics for COVID-19 and non-COVID-19 preprints posted on bioRxiv and medRxiv.
(A) Boxplots of abstract views, binned by preprint posting month. (B) Boxplots of PDF downloads, binned by preprint posting month. Boxplot horizontal lines denote lower quartile, median, upper quartile, with whiskers extending to 1.5*IQR. All boxplots additionally show raw data values for individual preprints with added horizontal jitter for visibility. The data underlying this figure may be found in https://github.com/preprinting-a-pandemic/pandemic_preprints and https://zenodo.org/record/4587214#.YEN22Hmnx9A. COVID-19, Coronavirus Disease 2019.
Fig 6
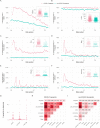
Fig 6. Usage of COVID-19 and non-COVID-19 preprints posted on bioRxiv and medRxiv between January 1 and October 31, 2020.
Panels (A)–(F) show the proportion of preprints receiving at least 1 citation or mention in a given source, with the exception of panel (B) which shows the proportion of preprints receiving at least 2 tweets (to account for the fact that each preprint is tweeted once automatically by the official bioRxiv/medRxiv Twitter accounts). The inset in each panel shows a boxplot comparing citations/mentions for all COVID-19 and non-COVID-19 preprints posted within our analysis period. Boxplot horizontal lines denote lower quartile, median, upper quartile, with whiskers extending to 1.5*IQR. All boxplots additionally show raw data values for individual preprints with added horizontal jitter for visibility. Data are plotted on a log-scale with +1 added to each count for visualisation. (G) Proportion of preprints included in reference lists of policy documents from 3 sources: the ECDC, UK POST, and WHO SB. (H) Spearman correlation matrix between indicators shown in panels (A)–(F), as well as abstract views and PDF downloads for COVID-19 preprints. (I) Spearman correlation matrix between indicators shown in panels (A)–(F), in addition to abstract views and PDF downloads for non-COVID-19 preprints. The data underlying this figure may be found in https://github.com/preprinting-a-pandemic/pandemic_preprints and https://zenodo.org/record/4587214#.YEN22Hmnx9A. COVID-19, Coronavirus Disease 2019; ECDC, European Centre for Disease Prevention and Control; UK POST, United Kingdom Parliamentary Office of Science and Technology; WHO SB, World Health Organization Scientific Briefs.

Similar articles

Cited by

References

    1. WHO. COVID-19 Weekly Epidemiological Update-11. 2020 Oct. Available from: https://www.who.int/docs/default-source/coronaviruse/situation-reports/w....
    1. Zhu N, Zhang D, Wang W, Li X, Yang B, Song J, et al.. A Novel Coronavirus from Patients with Pneumonia in China, 2019. N Engl J Med. 2020;382:727–33. 10.1056/NEJMoa2001017 - DOI - PMC - PubMed
    1. WHO. Coronavirus Disease (COVID-19) Weekly Epidemiological Update—24. 2021 Jan. Available from: https://www.who.int/docs/default-source/coronaviruse/situation-reports/2...
    1. Coronaviridae Study Group of the International Committee on Taxonomy of Viruses. The species Severe acute respiratory syndrome-related coronavirus: classifying 2019-nCoV and naming it SARS-CoV-2. Nat Microbiol. 2020;5:536–44. 10.1038/s41564-020-0695-z - DOI - PMC - PubMed
    1. Ksiazek TG, Erdman D, Goldsmith CS, Zaki SR, Peret T, Emery S, et al.. A Novel Coronavirus Associated with Severe Acute Respiratory Syndrome. In: 10.1056/NEJMoa030781 [Internet]. Massachusetts Medical Society; 7 October 2009. [cited 13 May 2020]. 10.1056/NEJMoa030781 - DOI - DOI

Publication types

close