Urban habituation, ecological connectivity and epidemic dampening: the emergence of Hendra virus from flying foxes (Pteropus spp.)
- PMID: 21561971
- PMCID: PMC3203503
- DOI: 10.1098/rspb.2011.0522
Urban habituation, ecological connectivity and epidemic dampening: the emergence of Hendra virus from flying foxes (Pteropus spp.)
Abstract
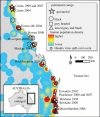
Anthropogenic environmental change is often implicated in the emergence of new zoonoses from wildlife; however, there is little mechanistic understanding of these causal links. Here, we examine the transmission dynamics of an emerging zoonotic paramyxovirus, Hendra virus (HeV), in its endemic host, Australian Pteropus bats (fruit bats or flying foxes). HeV is a biosecurity level 4 (BSL-4) pathogen, with a high case-fatality rate in humans and horses. With models parametrized from field and laboratory data, we explore a set of probable contributory mechanisms that explain the spatial and temporal pattern of HeV emergence; including urban habituation and decreased migration-two widely observed changes in flying fox ecology that result from anthropogenic transformation of bat habitat in Australia. Urban habituation increases the number of flying foxes in contact with human and domestic animal populations, and our models suggest that, in addition, decreased bat migratory behaviour could lead to a decline in population immunity, giving rise to more intense outbreaks after local viral reintroduction. Ten of the 14 known HeV outbreaks occurred near urbanized or sedentary flying fox populations, supporting these predictions. We also demonstrate that by incorporating waning maternal immunity into our models, the peak modelled prevalence coincides with the peak annual spill-over hazard for HeV. These results provide the first detailed mechanistic framework for understanding the sporadic temporal pattern of HeV emergence, and of the urban/peri-urban distribution of HeV outbreaks in horses and people.
Figures


Similar articles
- Reproduction and nutritional stress are risk factors for Hendra virus infection in little red flying foxes (Pteropus scapulatus).Proc Biol Sci. 2008 Apr 7;275(1636):861-9. doi: 10.1098/rspb.2007.1260.Proc Biol Sci. 2008.PMID: 18198149Free PMC article.
- A new Hendra virus genotype found in Australian flying foxes.Virol J. 2021 Oct 13;18(1):197. doi: 10.1186/s12985-021-01652-7.Virol J. 2021.PMID: 34641882Free PMC article.
- Using Stochastic Modeling to Predict the Effect of Culling and Colony Dispersal of Bats on Zoonotic Viral Epidemics.Vector Borne Zoonotic Dis. 2021 May;21(5):369-377. doi: 10.1089/vbz.2020.2700. Epub 2021 Mar 10.Vector Borne Zoonotic Dis. 2021.PMID: 33691497
- Hendra virus ecology and transmission.Curr Opin Virol. 2016 Feb;16:120-125. doi: 10.1016/j.coviro.2016.02.004. Epub 2016 Mar 12.Curr Opin Virol. 2016.PMID: 26978066Review.
- Hendra Virus Infection in Horses: A Review on Emerging Mystery Paramyxovirus.J Equine Vet Sci. 2020 Aug;91:103149. doi: 10.1016/j.jevs.2020.103149. Epub 2020 May 30.J Equine Vet Sci. 2020.PMID: 32684248Review.
Cited by
- Detection of Tioman Virus in Pteropus vampyrus Near Flores, Indonesia.Viruses. 2021 Mar 26;13(4):563. doi: 10.3390/v13040563.Viruses. 2021.PMID: 33810446Free PMC article.
- Evidence for novel hepaciviruses in rodents.PLoS Pathog. 2013;9(6):e1003438. doi: 10.1371/journal.ppat.1003438. Epub 2013 Jun 20.PLoS Pathog. 2013.PMID: 23818848Free PMC article.
- Longitudinal monitoring in Cambodia suggests higher circulation of alpha and betacoronaviruses in juvenile and immature bats of three species.Sci Rep. 2021 Dec 17;11(1):24145. doi: 10.1038/s41598-021-03169-z.Sci Rep. 2021.PMID: 34921180Free PMC article.
- Metapopulation dynamics enable persistence of influenza A, including A/H5N1, in poultry.PLoS One. 2013 Dec 2;8(12):e80091. doi: 10.1371/journal.pone.0080091. eCollection 2013.PLoS One. 2013.PMID: 24312455Free PMC article.
- Anthropogenic land use change and infectious diseases: a review of the evidence.Ecohealth. 2014 Dec;11(4):619-32. doi: 10.1007/s10393-014-0941-z. Epub 2014 May 23.Ecohealth. 2014.PMID: 24854248Review.
References
- Jones K. E., Patel N. G., Levy M. A., Storeygard A., Balk D., Gittleman J. L., Daszak P. 2008. Global trends in emerging infectious diseases. Nature 451, 990–99310.1038/nature06536 (doi:10.1038/nature06536) - DOI - DOI - PMC - PubMed
- Morse S. S. 1993. Examining the origins of emerging viruses. In Emerging viruses (ed. Morse S. S.), pp. 10–28 New York, NY: Oxford University Press
- Weiss R. A., McMichael A. J. 2004. Social and environmental risk factors in the emergence of infectious diseases. Nat. Med. 10, S70–S7610.1038/nm1150 (doi:10.1038/nm1150) - DOI - DOI - PMC - PubMed
- Lloyd-Smith J. O., George D., Pepin K. M., Pitzer V. E., Pulliam J. R., Dobson A. P., Hudson P. J., Grenfell B. T. 2009. Epidemic dynamics at the human–animal interface. Science 326, 1362–136710.1126/science.1177345 (doi:10.1126/science.1177345) - DOI - DOI - PMC - PubMed
Publication types
MeSH terms
Grants and funding
LinkOut - more resources
Full Text Sources
Miscellaneous

