

Abstract
Aims: To develop a method to assess model‐specific parameters for ultraviolet‐C (UV‐C, 254 nm) decontamination of filtering facepiece respirators (FFRs).
Methods and Results: UV‐C transmittance was quantified for the distinct composite layers of six N95 FFR models and used to calculate model‐specific α‐values, the percentage of the surface UV‐C irradiance available for the internal filtering medium (IFM). Circular coupons, excised from the FFRs, were exposed to aerosolized particles containing MS2 coliphage and treated with IFM‐specific UV‐C doses ranging from 38 to 4707 J m−2. Models exposed to a minimum IFM dose of 1000 J m−2 demonstrated at least a 3 log reduction (LR) in viable MS2. Model‐specific exposure times to achieve this IFM dose ranged from 2 to 266 min.
Conclusions: UV‐C transmits into and through FFR materials. LR of MS2 was a function of model‐specific IFM UV‐C doses.
Significance and Impact of the Study: Filtering facepiece respirators are in high demand during infectious disease outbreaks, potentially leading to supply shortages. Reuse of disposable FFRs after decontamination has been discussed as a possible remediation strategy, but to date lacks supporting scientific evidence. The methods described here can be used to assess the likelihood that UV‐C decontamination will be successful for specific FFR models.
Keywords: decontamination, filtering facepiece respirator, influenza, pandemic, UV‐C
Introduction
The supply of National Institute for Occupational Safety and Health (NIOSH)‐certified N95 filtering facepiece respirators (FFRs) may become limited during an influenza pandemic [Institute of Medicine (U.S.) Committee on the Development of Reusable Facemasks for Use During an Influenza Pandemic et al. (2006)]. Current guidance states that these disposable devices should be discarded after each use (donning and doffing) to prevent self‐inoculation with infectious material on the surface of the respirator. Extending the lifetime of FFRs for multiple uses (e.g. multiple donnings) may help to alleviate the supply demand (Viscusi et al. 2007, 2009a,b; Roberge 2008). One option that may permit FFR reuse is the decontamination or removal of the infectious material from the FFR through one or more physical or chemical treatments. For this option to be practical, the decontamination treatment must maintain FFR fit and filtration performance and not leave hazardous residues. Other desired attributes for a decontamination method for FFR reuse would be low cost, high throughput and ease of use (Viscusi et al. 2009b). Today, no validated decontamination methods for FFRs exist (OSHA 2008; HPA 2009), but research is underway to determine whether this is feasible (Viscusi et al. 2007, 2009b; Fisher et al. 2009; Vo et al. 2009).
Ultraviolet germicidal irradiation (UVGI) using ultraviolet‐C (UV‐C, 254 nm) has been suggested as a viable option for this application (Viscusi et al. 2007). Most recently, nine FFR models were evaluated for changes in physical appearance, odour and laboratory performance (filter aerosol penetration and filter airflow resistance) following simulated decontamination using five different methods, including UV‐C (Viscusi et al. 2009b). In that study, UV‐C treatment did not affect the filter aerosol penetration, filter airflow resistance or physical appearance of the FFRs. In another study, (Vo et al. 2009) demonstrated that a 4·32 J cm−2 (43 200 J m−2) dose of UV‐C achieved approximately 3 log reduction (LR) of MS2 virus applied as droplets to an FFR, while higher UV‐C doses (>7·20 or 72 000 J m−2) yielded no detectable MS2 virus. However, concerns remain about the ability of UV‐C to inactivate infectious particles within the fibrous web of layers of an FFR.
The effectiveness of UV‐C as a decontamination method is affected by several parameters, including the topography of the contaminated surface and the location of the micro‐organisms within the substrate. The use of UV‐C for surfaces is mainly for hard, nonporous substrates (Andersen et al. 2006; Rastogi et al. 2007). For these substrates, the microbial contamination is deposited on the surface exterior, thus UV‐C decontamination of viruses (Tseng and Li 2007), spores (Gardner and Shama 1998) and other microbes (Gorsuch et al. 1998) has been shown to be effective. Irregular and porous surfaces are considered problematic because of the lack of UV‐C penetration. UV‐C does not readily penetrate into solid surfaces as the light is absorbed or reflected by the substrate material. Decontamination efficacy decreases if UV‐C cannot effectively penetrate shielded areas (Gardner and Shama 2000) (Tseng and Li 2007).
UV‐C transmittance is possible through the small gaps and fibres of porous surfaces such as textiles. In fact, UV‐C transmission through clothing and textiles (both woven and nonwoven) has been previously described (Kerr et al. 2000; Hoffmann et al. 2001). Furthermore, a NIOSH health hazard evaluation report of surgical suite personnel found that UV‐C penetrated some surgical masks and gowns, suggesting that UV‐C should also penetrate FFRs (Sylvain and Tapp 2009).
Research to evaluate the penetration and decontamination efficacy of UV‐C applied to FFRs is lacking. NIOSH‐certified N95 FFRs are manufactured using a variety of materials in assorted shapes and colours, although they all share some common attributes. For example, the nine FFR models studied previously (Viscusi et al. 2009b) were comprised of multiple layers of woven and nonwoven materials. Generally, the inner and outer layers provide form, stability, comfort, water resistance and filtration of large particles. The internal filtering medium (IFM) is usually comprised of spun‐bonded polypropylene and provides the bulk of the filtration efficiency (Barrett and Rousseau 1998). The aim of this study was to develop a method to assess model‐specific parameters for UV‐C decontamination of FFRs using measured UV‐C transmittance values. UV‐C transmittance through the layers of several FFR models was quantified and used to calculate FFR model‐specific UV‐C doses. The methodology used to generate this data will be useful to respirator manufacturers, infection control experts and other researchers to optimize FFR design and UV‐C parameters (irradiance, time, etc.) for possible application to FFR reuse if authorized during an FFR supply shortages for emergency situations.
Materials and methods
FFR spatial relation and layer terminology
Figures 1a,b demonstrate the interfaces and the layers of the respirator as defined by this research. For the purposes of this study, the term outer layer corresponds to the layer most distant from the wearer (environment interface). The term inner layer corresponds to the layer closest to the wearer (user interface). Both the outer and the inner layers are the exterior layers of the respirator. Interior layers are situated between the outer and inner layers and are normally comprised of filtering medium. The filtering medium, whether single or multilayered, is designated as the IFM.
Figure 1.
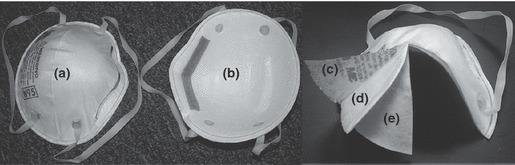
FFR interfaces and layers, (a) environment interface, (b) user interface, (c) outer layer, (d) internal layer, and (e) inner layer.
FFR selection and layer determination
The six FFR models, used in this study, are NIOSH‐approved N95 FFRs. Two models, the Cardinal N95‐ML (Model A) and the Wilson SAF‐T‐FIT® Plus (Model B), were selected from laboratory stock. Four models, namely, the 8210 (Model C), 1860 (Model D), and 1870 (Model F) from 3M™ and the Kimberly‐Clark PFR95‐174 (Model E), were selected from the list of models available in the Center for Disease Control and Prevention’s Strategic National Stockpile and used in previous research (Viscusi et al. 2009b). The FFRs were cut into 5‐cm2 circular coupons and then pulled apart to generate multiple, distinct layers. A layer was determined to be distinct if it separated from adjoining layers without damage to any portion of the respirator media.
Aerosol penetration and airflow resistance by composite layers
A Model 8130 Automated Filter Tester (AFT) (TSI, Inc., St. Paul, MN, USA) was used to measure initial sodium chloride penetration and airflow resistance (R) for all layers of each FFR model. The percentages of aerosol penetrating each layer (%P) were determined by placing an approximately 3″ diameter swatch of each FFR layer in between Plexiglas test plates. The Plexiglas plates containing a filter layer were placed between the two chucks of the Model 8130 AFT filter holder under conditions previously described (Viscusi et al. 2007). The filter penetration results were converted to filtration efficiencies (FE = 100–%P).
UV‐C penetration (transmittance) measurement
UV‐C transmittance through the respirator layers was determined for the six N95 FFR models, using a biological safety cabinet (SterilGARD® III Advance; The Baker Company, Sanford, ME, USA) equipped with a low pressure mercury arc lamp (TUV 36T5 40 W, Philips, Somerset, NJ) to generate UV‐C light. The light irradiance was measured with a UV‐X‐25 sensor connected to a UV‐X radiometer (UV‐CP Inc., Upland, CA, USA). The operating manual for the radiometer defines the measurement as UV intensity, but will be termed irradiance in this manuscript.
Three 5‐cm2 circular coupons were excised from the studied respirators (1 coupon/respirator) and separated into layers as described previously. Bidirectional UV‐C irradiance was measured both from the outer layer to the inner layer (towards the user interface) and from the inner layer to the outer layer (away from the user interface). UV‐C transmittance was determined after the successive addition of each coupon layer starting with the outer or inner layer and adding the layers in the proper order and orientation. FFR coupons were placed over the UV‐X sensor and exposed to UV‐C light. UV‐C transmittance was measured in triplicate from coupons excised from three FFRs for each model.
Calculation of α, the available UV‐C for decontamination
The measured transmittance data were used to determine the effective UV‐C irradiance for each layer of each model. Simply, the measured transmitted irradiance (i.e. the UV‐C that gets through a given layer (i), or  , becomes the incoming irradiance for the next layer (
 ). The surface irradiance (IS) is the (
 ) for the most exterior layers. The factor α, which is the intercepted or nontransmitted UV‐C fraction, can be calculated for each layer (relative to its orientation in the FFR) in either direction using the following equation:
| 1 |
Summing the α‐values of the filtering layers (αi) of the IFM made from both directions (n = number of filtering layers × 2) results in αIFM, which is the available UV‐C reaching the IFM for each model as a percentage of the IS.
| 2 |
This factor represents the percentage of UV‐C available for decontamination and is similar to the exposure factor calculated by Gardner and Shama 2000. The αIFM values are related to the UV‐C transmittance of the exterior layers. Higher transmittance values of exterior layers can lead to higher αIFM values, while exterior layers that shield the UV‐C from reaching the internal layers (i.e. lower IT) will lead to lower αIFM values.
Media, virus, and host cells
The media, virus and host cells, used in this research, have been described previously (Fisher et al. 2009). Briefly, American Type Culture Collection (ATCC) medium 271 (http://www.atcc.org/Attachments/3600.pdf) was used for growth of Escherichia coli and preparation, storage, recovery and assay of MS2 bacteriophage (ATCC 15597‐B1). The aerosol‐generating medium was comprised of 1% ATCC medium 271 (deionized water was used as the diluent for 1% ATCC medium 271).
UV‐C decontamination experiment
The αIFM was used to categorize FFRs as most shielded (≤5%), moderately shielded (>5% but ≤30%) and least shielded (>30%). UV‐C decontamination of MS2 was determined for FFR coupons excised from two FFR models from each shielded category. Experimental coupons (n = 4) and control coupons (n = 2) were loaded with approximately 107 plaque‐forming units of MS2 as previously described (Fisher et al. 2009). For models C and F, the MS2‐contaminated coupons were exposed to UV‐C (25 ± 1·0 W m−2) for combined bidirectional treatment times of 1, 2, 4 and 10 min (0·5, 1, 2, 5 min per side). Only the 10‐min exposure was performed on model A because of a low αIFM. A supplemental experiment for Model A was performed using a bidirectional treatment time of 5 h.
Specific UV‐C doses (J m−2) to the IFM (DIFM) for each model can be calculated as follows:
| 3 |
where αIFM is given by eqn (2), t is the exposure time (s), and Is is the surface irradiance (W m−2) from eqn (1). FFR models B, D and E were exposed to UV‐C (25 ± 1·0 W m−2) in a bidirectional manner for the model‐dependent treatment times corresponding to DIFMs of 300, 1000 and 3000 J m−2. To account for any temperature effects from long exposure times, contaminated control coupons were covered with a plastic cap and exposed alongside experimental coupons under the UV‐C source.
A dose–response curve was constructed for the MS2 decontamination by plotting the average LR per coupon as a function of the DIFM for each model for each time‐point.
Virus recovery and enumeration
The control and experimental coupons were placed in 50‐ml conical tubes containing 10 ml of 271 B medium. Virus was recovered from the coupons by agitation for 1 min using a Vortex‐Genie® 2 G‐560 (Scientific Industries, Bohemia, NY, USA). The coupons were discarded, and the virus was enumerated using a single agar layer method as previously described (Fisher et al. 2009).
Data analysis
The antiviral activity of the UV‐C treatment methods of the FFR coupons was determined by calculating the log10 N N0−1; where N0 is the titre of viable MS2 recovered from the covered control coupons and N is the titre of the viable virus recovered from the treated coupons. A two‐way analysis of variance with replication (95% confidence level) was performed, using Microsoft EXCEL (Microsoft Office 2007), to determine statistical significance of the data among FFR models and doses. Regression analysis of MS2 inactivation curves was performed using the Gearaerd and Van Impe Inactivation Model Fitting Tool (GInaFit) freeware tool for Microsoft EXCEL (Cerf 1977; Geeraerd et al. 2005). The biphasic model was used to model MS2 inactivation for supplied (exposed) dose and DIFM and the coefficient of determination (R2) and the root mean sum of squared errors (RMSE) were compared (Cerf 1977; Kowalski 2000).
Results
Table 1 identifies the filtration layers (bold values) of each FFR model and lists the bidirectional available UV‐C (α‐values) for all layers. The exterior layers received the majority of the available UV‐C with α‐values measuring from 23 to 50%. The α‐values for the individual filtering layers ranged from 0·05 to 22%. Four models, A, B, C and D, demonstrated αIFM values of <10%, while the models E and F had values of 30 and 31%, respectively. The αIFM values permitted the division of FFR models into three UV‐C shielding categories as shown in the bottom row of Table 1.
Table 1.
Bidirectional α‐values of the composite layers of filtering facepiece respirators (FFRs) and categorization by αIFM
| FFR | A | B | C | D | E | F |
|---|---|---|---|---|---|---|
| Layer 1 (outer) | 49·98 | 48·9 | 43·6 | 36·21 | 33·63 | 36·86 |
| Layer 2 | 0·05 | 1·09 | 5·25 | 4·61 | 16·17 | 7·89 |
| Layer 3 | 0·05 | 1·09 | 0·86 | 8·50 | 13·84 | 9·42 |
| Layer 4 (inner B, C, D) | 0·16 | 49·0 | 50·3 | 50·67 | 2·88 | 21·96 |
| Layer 5 (inner A, E, F) | 49·76 | NA | NA | NA | 33·33 | 23·44 |
| Shielded category | Most | Moderately | Least | |||
| αIFM | 0·25 | 2·18 | 6·11 | 8·5 | 30·01 | 31·38 |
All values in percentage. Bold values indicate filtering layers.
The FEs of the individual layers of each FFR model using the TSI 8130 AFT confirmed the visual determination of the layers which comprise the IFM. The filtration layers, marked as bold values in Table 2, had efficiencies >87% with the majority performing at 94% or better. The filtration performance for layers not determined to be filtering in function were <31%. Likewise, Table 2 shows the differential airflow resistances of the layers of the IFM (ranging from 2·5 to 7·6 mm H2O) exceeded the values for all other layers for all FFRs (ranging from 0·1 to 0·7 mm H2O).
Table 2.
Filtration efficiency (FE) and airflow resistance (R) of the composite layers of filtering facepiece respirators (FFRs)
| FFR | A | B | C | D | E | F | ||||||
|---|---|---|---|---|---|---|---|---|---|---|---|---|
| FE (%) | R (mm H2O) | FE (%) | R (mm H2O) | FE (%) | R (mm H2O) | FE (%) | R (mm H2O) | FE (%) | R (mm H2O) | FE (%) | R (mm H2O) | |
| Layer 1 | 15·1 | 0·3 | 25·6 | 0·3 | 30·3 | 0·3 | 20·2 | 0·3 | 15·6 | 0·4 | 13·0 | 0·7 |
| Layer 2 | 94·3 | 4·2 | 94·5 | 4·7 | 90·5 | 2·5 | 12·6 | 0·1 | 87·2 | 7·6 | 11·8 | 0·5 |
| Layer 3 | 94·3 | 4·9 | 92·3 | 4·6 | 96·7 | 3·7 | 99·5 | 7·1 | 87·2 | 6·8 | 97·2 | 4·2 |
| Layer 4 | NT | NT | 13·4 | 0·3 | 16·9 | 0·5 | 16·8 | 0·5 | 12·4 | 0·2 | 97·2 | 4·5 |
| Layer 5 | 8·5 | 0·2 | 11·0 | 11·1 | 0·7 | |||||||
Bold values indicate filtering layers.
NT, not tested.
Table 3 lists the DIFMs and measured LRs of Models A, C and F for the bidirectional treatment times of 1, 2, 4 and 10 min. The supplied dose at each treatment time was the same for each FFR model, but the DIFM varied because of the model‐specific αIFM values. LRs within a given treatment time differed among the FFR models. A 10‐min treatment (the only treatment condition with data for all three models) produced LRs of 0·1 (model A), 2·9 (model C), and >4·8 (model F). Across models A, C and F and within models C and F, LR increased with increasing DIFMs.
Table 3.
Calculated DIFM and measured log reductions (LR) of MS2 for targeted UV‐C exposure times. The supplied dose for each treatment time was equivalent for each model
| Time (min) | 1 | 2 | 4 | 10 | ||||
|---|---|---|---|---|---|---|---|---|
| Model | J m−2 | LR | J m−2 | LR | J m−2 | LR | J m−2 | LR |
| A | 4 | NT | 8 | NT | 15 | NT | 38 | 0·1 ± 0·2 |
| C | 92 | 1·7 ± 0·1 | 183 | 2·4 ± 0·1 | 367 | 2·6 ± 0·4 | 917 | 2·9 ± 0·2 |
| F | 471 | 2·5 ± 0·3 | 941 | 3·1 ± 0·5 | 1883 | 4·1 ± 0·3 | 4707 | >4·8* |
NT, not tested.
*Reached detection limits.
The calculated treatment times and LRs for models B, D and E are shown in Table 4. The treatment times required to reach the targeted DIFMs of 300, 1000 and 3000 J m−2 differed for each model. LRs were statistically different among the models for DIFMs of 300 J m−2 (P = 0·006) and 3000 J m−2 (P < 0·001). The results for the 1000 J m−2 treatment among the models were statistically similar (P = 0·79). LRs increased with increased DIFM for models B (P < 0·001) and D (P < 0·001). The LRs reported for model E did not differ significantly among all three doses (P = 0·18).
Table 4.
Calculated exposure times (min) and log reductions (LR) of MS2 for targeted DIFM
| DIFM (J m−2) | 300 | 1000 | 3000 | |||
|---|---|---|---|---|---|---|
| Model | Min | LR | Min | LR | Min | LR |
| B | 9·6 | 2·3 ± 0·2 | 31·9 | 3·3 ± 0·1 | 95·6 | 4·0 ± 0·1 |
| D | 2·5 | 3·0 ± 0·4 | 8·2 | 3·5 ± 0·5 | 24·5 | >5·1* |
| E | 0·7 | 3·2 ± 0·3 | 2·3 | 3·6 ± 0·4 | 6·9 | 3·4 ± 0·2 |
The measured irradiance was approximately 24 W m−2.
*Reached detection limits.
Table 5 contains the calculated exposure times required to achieve a DIFM of 1000 J m−2 for each model‐specific αIFM with a UV‐C irradiance of 25 W m−2, which range from 266 to 2 min. Table 5 also depicts the LRs associated with tested DIFMs of 1000 ± 125 J m−2. LRs for the approximate 1000 J m−2 DIFM ranged from 2·86 to 3·59, with the lowest LR value (2·86) corresponding to the lowest DIFM (917 J m−2).
Table 5.
Calculated αIFM exposure times and log reductions (LRs) for DIFM of 1000
| Model | A | B | C | D | E | F |
|---|---|---|---|---|---|---|
| α internal filtering medium | 0·25 | 2·18 | 6·11 | 8·5 | 30·01 | 31·38 |
| Time (min) | 266 | 32 | 10 | 7 | 2 | 2 |
| LR | 3·0* | 3·3† | 2·9‡ | 3·5* | 3·6* | 3·1§ |
Reported LRs are for measured doses as indicated.
*Dose, 1125 J m−2.
†Dose, 1000 J m−2.
‡Dose, 917 J m−2.
§Dose, 941 J m−2.
Discussion
The information presented in this study provides an effective method to calculate UV‐C doses for the decontamination of FFRs. UV‐C decontamination is based on supplying an adequate dose to the contaminated area. UV‐C dose required for decontamination, which is microbe specific, is a function of irradiance and time. The UV‐C irradiance decreases with distance, especially when travelling through a substrate (e.g. FFR), where UV absorption and reflection are factors. Irradiance is also affected by microbial concentrations and the level of protective residues; however, consideration of these factors is the subject of another manuscript. Determining the UV‐C transmittance through the FFR material provides for a more accurate estimate of the irradiance supplied to the microbial contaminant. With a more accurate assessment of the irradiance, treatment times can be adjusted to achieve the targeted dose for the specific micro‐organism.
UV‐C radiation applied to FFRs will be transmitted, reflected or absorbed by the fibres of the multilayered substrate similar to other textiles (Hoffmann et al. 2001; Duleba‐Majek 2009). The transmittance of UV‐C through the layers of the FFR will largely occur through the gaps and pores between the fibres of the material. The materials in the inner and outer layers are more porous than the IFM as demonstrated by a comparative decrease in airflow resistance during the aerosol penetration tests (Table 2). The porosity of the inner and outer layers allows UV‐C to reach the IFM. The reflection and absorption of UV‐C will also be dependent upon other textile properties (e.g. weight and thickness) and the chemical composition of the fibres and/or other materials present such as dyes and delustrants. For a given layer, the reflected and absorbed UV‐C, which is the collective radiation that has impacted the surface, is assumed to be available for decontamination. The UV‐C that is transmitted through the pores or gaps of a layer becomes the potential available UV‐C for the next stratum.
The irradiance values used in this study for calculating UV‐C doses for FFR decontamination are based on the effective irradiation for the IFM. Being in the interior of the FFR, the IFM is the most challenging layer(s) to expose to UV‐C irradiation. The IFM, by design, provides the majority of the filtration performance to FFRs and should be the target of the UV‐C dose. In some instances (e.g. cough or sneeze that contain large wet droplets), the layers exterior to the IFM may capture the majority of the particles. However, even a fraction of the microbial contamination deposited on the IFM would be challenging to decontaminate. Thus, a specific dose calculated to decontaminate the IFM will provide an excess amount of UV‐C to the inner or outer layers. The excess UV‐C to the inner and outer layers provides a ‘safety factor’ to ensure a higher level of decontamination for the FFR exterior, which may reduce the hazard caused by contact transmission of infectious organisms.
The effectiveness of calculating model‐specific DIFMs is supported by the goodness of fit (R2 = 0·87, RMSE = 0·39) of the biphasic curve for all the decontamination experiments performed (Fig. 2). The biphasic analysis of the LRs (not shown) vs the supplied dose is more scattered because of the exclusion of model‐specific αIFM values (R2 = 0·36, RMSE = 0·88). Biphasic curves have been used to model thermal, nonthermal, pulsed field and UV‐C inactivation and occur as a result of a resistant subpopulation of microbes or other factors, such as, microbial clumping, microbial protection via particulate matter or localization on the substrate (Cerf 1977; Kowalski 2000; Geeraerd et al. 2005).
Figure 2.
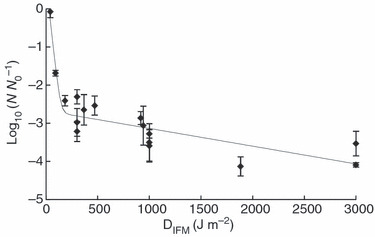
Dose–response relationship of MS2 inactivation on FFR coupons exposed to UV‐C. The data points represent the average LR of MS2 on FFR coupons exposed to UV‐C doses determined for the internal filtering medium using αIFM. The error bars represent ±1 standard deviation range for quadruplicate coupons (n = 4). The trend line is the biphasic mdel generated using the GInaFit freeware tool.
An examination of the data for the 10‐min UV‐C exposure of FFR representatives of the most shielded, moderately shielded and least shielded categories reveals the importance of calculating the DIFM (Table 3). A 10‐min exposure to a UV‐C surface irradiance of 25 W m−2 equates to a supplied dose of 15 000 J m−2 for each tested model. The LRs of 0·1, 2·9 and >4·8 for models A, C and F, respectively, would have been inconsistent if an equal dose was assumed. However, DIFMs of 38, 917 and 4707 J m−2 for models A, C and F, respectively, are consistent with the LR values. Variation in the decontamination efficiency among the FFR models is expected considering the differences in DIFMs.
The results of the targeted dose treatments (Table 4) further support the relationship of DIFM and MS2 decontamination, although unanticipated variation in decontamination efficacy across FFR models was evident for the 300 and 3000 J m−2 DIFMs. This variation may provide insight into factors important to UV‐C decontamination of FFRs. For the DIFM of 300 J m−2, some variability would be expected because of the steep slope of the initial phase of the biphasic curve (Fig. 2). In this initial phase, the shielding effect, or protection of the virus from UV‐C, seems to be limited, which is in contrast to the results of the 3000 J m−2 treatment. The statistical variation for this treatment may hint at an FFR model‐specific decontamination limit, which results from shielding or blocking of UV‐C by the composite layers of the FFR. This is similar to the shielding effect described in Gardner and Shama (2000). Across the models, this effect can be observed as the tailing of the biphasic curve (Fig. 2), although other factors such as virus clumping and UV‐C resistance of a subpopulation of virus may produce similar results (Kowalski 2000). The results for the UV‐C decontamination of model E provide further support for a model‐specific decontamination limit. For this FFR model, UV‐C efficacy approaching the decontamination limit was achieved with the lowest tested DIFM of 300 J m−2 and remained statistically the same for all three DIFMs tested (Table 4).
UV‐C treatments of an approximate DIFM of 1000 J m−2 produced similar LRs for all models tested (Table 5). The consistent MS2 LR values demonstrate the importance of αIFM values in determining the duration of UV‐C exposure times. Calculated exposure times to achieve a model‐specific DIFM of 1000 J m−2 ranged from 266 min for Model A to 2 min for Model F, representing the most shielded to least shielded categories. Exposure times of <8 min for the targeted DIFM, given an irradiance of 25 W m−2, are possible with αIFM values of 8·5 and greater (Models D–F). Model B, of the most shielded category (α = 2·18%), demonstrated a 3·2 LR with a treatment time of 32 min. Even with low αIFM values, significant LRs are possible with longer exposure times as demonstrated in this study or increased UV‐C irradiance, which would also provide an increase in dose. The demonstrated decontamination of FFRs with low αIFM values is promising for real world application.
The determination of the UV‐C transmittance and α‐values for the layers of an FFR is simple when using a radiometer. This process can be further simplified because of the ease by which filtering media is visually distinguishable from the other layers of an FFR (although filtration data would be preferable). The material used in the IFM appears to be less porous than the surrounding layers and of similar composition across model types. For all models examined, the filtering medium was located in the interior of the mask. By combining all the media that comprise the filtering layers into one stratum (the IFM) and compiling separate strata for the media to the exterior of the IFM in both directions, the number of layers can be minimized along with the number of measurements required to ascertain the transmittance data. Simple calculation [eqns (1) and (2)] using the transmittance data produces αIFM values, which is necessary to generate FFR model‐specific DIFMs. Reducing the number of layers by separating the IFM from the other composite strata of the FFR also minimizes the complexity of deciphering what is or is not a separate and distinctive layer.
Model‐specific αIFM values will determine the necessary UV‐C exposure time, given a targeted dose and the UV‐C source. The potential to decontaminate specific FFR models to a targeted LR value can be determined by evaluating the exposure times required to achieve desired doses. A minimum αIFM could be adopted during a reuse emergency, thereby defining FFR models that are more likely to lead to successful UV‐C decontamination. The αIFM values may also help in the selection of an adequate UV‐C source as an increase in irradiance would decrease treatment times given the targeted DIFM.
Producing an IFM model‐specific bidirectional (from both directions) DIFM provides the highest level of decontamination potential. Microbial contamination may emanate from the environment and/or from the user and deposit on all the layers of an FFR. A bidirectional UV‐C exposure targeted for the IFM will provide a dose adequate for microbial decontamination on the IFM, while providing an excessive dose for the exterior layers. However, a bidirectional target of the IFM may not be essential. Limiting the exposure to one direction, from outer to inner, may provide an adequate dose for decontamination while limiting the complexities of a two‐sided bidirectional treatment. The method to determine αIFM values and DIFMs described previously for bidirectional treatments is applicable to single direction exposures as well. Depending on the model‐specific composition of the exterior layers, the αIFM may be greater for a single direction exposure compared to a bidirectional treatment. The outer layer and IFM are more likely to contain the microbial threat, assuming that the wearer is healthy.
Limitations
Examining the effect of the FFR materials on UV‐C decontamination would provide valuable insight and assist in discerning the model‐specific‐decontamination efficacies, but is beyond the scope of this research. Likewise, material constituents are proprietary information of the manufacturers and are not readily known.
Further research is necessary for the development of protocols to generalize decontamination of FFRs with UV‐C. These studies were performed on a single plane, flat surface (coupons) with a single UV‐C source. Furthermore, the model‐specific αIFM values were determined by disassembling and then reassembling the FFR layers, which might have resulted in additional variation because of the incorrect orientation. The testing of complete, intact FFRs would provide a perspective on the effects of the multiple planes of the three‐dimensional form and other components such as straps and face‐seal interfaces. An examination of the use of multiple UV‐C sources may also be important to develop an FFR decontamination method. This issue has previously been explored for dental equipment, which presents similar surface irregularity challenges as FFRs in terms of irregular shapes and protein challenges (von Woedtke et al. 2003). The use of multiple sources may also lessen the effects of shielding from the material composition of the distinct layers and therefore increase the model‐specific limit of decontamination.
Studies to examine the effect of UV‐C on other micro‐organisms specific to respiratory illnesses will provide a better assessment of the influence of multilayered air‐permeable materials on microbial decontamination kinetics. The physical and chemical protection of micro‐organisms by residues, such as, sputum, blood, soil, etc., is also a concern for all methods of decontamination. Although well studied in water and air decontamination, protection residues were not examined in this study. Therefore, the effects of residues on UV‐C FFR decontamination are unknown but may be similar to those described in air and water research. We are currently exploring the efficacy of multiple decontaminations of FFRs repeatedly challenged with virus‐containing droplet nuclei and exposed to UV‐C. This research, which is being conducted using varying levels of organic challenge as a protection factor, will provide insight into the effects of protein deposition on the penetration/decontamination efficacy of UV‐C.
Acknowledgements
The authors express their sincere gratitude to Dr Debra Novak, Dr Samy Rengasamy, Dr Evanly Vo, Dr Benjamin C. Eimer, Mr Dennis Viscusi, Mr Mike Bergman and the manuscript reviewers for their suggestions and contributions.
Disclaimer
The findings and conclusions in this manuscript are those of the authors and do not necessarily represent the views of the National Institute for Occupational Safety and Health (NIOSH). Mention of company names or products does not constitute endorsement by NIOSH.
Contributor Information
E.M. Fisher, National Institute for Occupational Safety and Health, National Personal Protective, Technology Laboratory, Pittsburgh, PA, USA
R.E. Shaffer, National Institute for Occupational Safety and Health, National Personal Protective, Technology Laboratory, Pittsburgh, PA, USA.
References
- Andersen,B.M., Banrud,H., Boe,E., Bjordal,O. and Drangsholt,F. (2006) Comparison of UV C light and chemicals for disinfection of surfaces in hospital isolation units. Infect Control Hosp Epidemiol 27, 729–734. [DOI] [PubMed] [Google Scholar]
- Barrett,L.W. and Rousseau,A.D. (1998) Aerosol loading performance of electret filter media. Am Ind Hyg Assoc J 59, 532–539. [Google Scholar]
- Cerf,O. (1977) Tailing of survival curves of bacterial spores. J Appl Bacteriol 42, 1–19. [DOI] [PubMed] [Google Scholar]
- Duleba‐Majek,M. (2009) Transmission of UV radiation through woven fabrics in dependence on the inter‐thread spaces. Fibres Text East Eur 17, 34–38. [Google Scholar]
- Fisher,E.M., Rengasamy,S., Viscusi,D.J., Vo,E. and Shaffer,R.E. (2009) Development of a test system to apply virus‐containing particles to filtering facepiece respirators for the evaluation of decontamination procedures. Appl Environ Microbiol 75, 1500–1507. [DOI] [PMC free article] [PubMed] [Google Scholar]
- Gardner,D.W.M. and Shama,G. (1998) The kinetics of Bacillus subtilis spore inactivation on filter paper by uv light and uv light in combination with hydrogen peroxide. J Appl Microbiol 84, 633–641. [Google Scholar]
- Gardner,D.W.M. and Shama,G. (2000) Modeling UV‐induced inactivation of microorganisms on surfaces. J Food Prot 63, 63–70. [DOI] [PubMed] [Google Scholar]
- Geeraerd,A.H., Valdramidis,V.P. and Van Impe,J.F. (2005) GInaFiT, a freeware tool to assess non‐log‐linear microbial survivor curves. Int J Food Microbiol 102, 95–105. [DOI] [PubMed] [Google Scholar]
- Gorsuch,E.L., Grinshpun,S.A., Willeke,K., Reponen,T., Moss,C.E. and Jensen,P.A. (1998) Method for evaluating germicidal ultraviolet inactivation of biocontaminated surfaces. Int J Occup Saf Ergon 4, 287–297. [DOI] [PubMed] [Google Scholar]
- Hoffmann,K., Laperre,J., Avermaete,A., Altmeyer,P. and Gambichler,T. (2001) Defined UV protection by apparel textiles. Arch Dermatol 137, 1089–1094. [PubMed] [Google Scholar]
- HPA (2009) HPA Interim Advice on Extending the Lifespan of Facemasks and Respirators. UK: Health Protection Agency. [Google Scholar]
- Institute of Medicine (U.S.) Committee on the Development of Reusable Facemasks for Use During an Influenza Pandemic, Institute of Medicine (U.S.) and Board on Health Sciences Policy and National Academies Press (U.S.) (2006) Reusability of Facemasks During an Influenza Pandemic: Facing the Flu. Washington, D.C.: National Academies Press. [Google Scholar]
- Kerr,N., Capjack,L. and Fedosejevs,R. (2000) Ability of textile covers to protect artifacts from ultraviolet radiation. JAIC 39, 345–353. [Google Scholar]
- Kowalski,W.J. (2000) Mathematical modeling of ultraviolet germicidal irradiation for air disinfection. Quant Microbiol 2, 249. [Google Scholar]
- OSHA (2008) Proposed Guidance on Workplace Stockpiling of Respirators and Facemasks for Pandemic Influenza ed. Washington, DC: DOL. [Google Scholar]
- Rastogi,V.K., Wallace,L. and Smith,L.S. (2007) Disinfection of Acinetobacter baumannii‐contaminated surfaces relevant to medical treatment facilities with ultraviolet C light. Mil Med 172, 1166–1169. [DOI] [PubMed] [Google Scholar]
- Roberge,R.J. (2008) Effect of surgical masks worn concurrently over N95 filtering facepiece respirators: extended service life versus increased user burden. J Public Health Manag Pract 14, E19–E26. [DOI] [PubMed] [Google Scholar]
- Sylvain,D. and Tapp,L. (2009) Health hazard evaluation report: UV‐C exposure and health effects in surgical suite personnel. Department of Health and Human Services, Centers for Disease Control and Prevention, National Institute for Occupational Safety and Health.
- Tseng,C.C. and Li,C.S. (2007) Inactivation of viruses on surfaces by ultraviolet germicidal irradiation. J Occup Environ Hyg 4, 400–405. [DOI] [PMC free article] [PubMed] [Google Scholar]
- Viscusi,D.J., King,W.P. and Shaffer,R.E. (2007) Effect of decontamination on the filtration efficiency of two filtering facepiece respirator models. J Int Soc Respir Prot 24, 93–107. [Google Scholar]
- Viscusi,D.J., Bergman,M.S., Sinkule,E. and Shaffer,R.E. (2009a) Evaluation of the filtration performance of 21 N95 filtering face piece respirators after prolonged storage. Am J Infect Control 37, 381–386. [DOI] [PMC free article] [PubMed] [Google Scholar]
- Viscusi,D.J., Bergman,M.S., Eimer,B.C. and Shaffer,R.E. (2009b) Evaluation of five decontamination methods for filtering facepiece respirators. Ann of Occup Hyg 53, 815–827. [DOI] [PMC free article] [PubMed] [Google Scholar]
- Vo,E., Rengasamy,S. and Shaffer,R.E. (2009) Development of a test system to evaluate decontamination procedures for viral droplets on respirators. Appl Environ Microbiol 75, 7303–7309. [DOI] [PMC free article] [PubMed] [Google Scholar]
- Von Woedtke,T., Julich,W.D., Thal,S., Diederich,M., Stieber,M. and Kindel,E. (2003) Antimicrobial efficacy and potential application of a newly developed plasma‐based ultraviolet irradiation facility. J Hosp Infect 55, 204–211. [DOI] [PubMed] [Google Scholar]