

Abstract
To explain the observed phenomenon that most SARS‐CoV‐2 transmission occurs indoors whereas its outdoor transmission is rare, a simple macroscopic aerosol balance model is developed to link short‐ and long‐range airborne transmission. The model considers the involvement of exhaled droplets with initial diameter ≤50 µm in the short‐range airborne route, whereas only a fraction of these droplets with an initial diameter within 15 µm or equivalently a final diameter within 5 µm considered in the long‐range airborne route. One surprising finding is that the room ventilation rate significantly affects the short‐range airborne route, in contrast to traditional belief. When the ventilation rate in a room is insufficient, the airborne infection risks due to both short‐ and long‐range transmission are high. A ventilation rate of 10 L/s per person provides a similar concentration vs distance decay profile to that in outdoor settings, which provides additional justification for the widely adopted ventilation standard of 10 L/s per person. The newly obtained data do not support the basic assumption in the existing ventilation standard ASHRAE 62.1 (2019) that the required people outdoor air rate is constant if the standard is used directly for respiratory infection control. Instead, it is necessary to increase the ventilation rate when the physical distance between people is less than approximately 2 m.
Keywords: close contact, expired jet, long‐range airborne transmission, respiratory infection, SARS‐CoV‐2, short‐range airborne transmission, ventilation
Practical implications:
For some respiratory infections such as COVID‐19, a low building ventilation rate worsens both long‐ and short‐range airborne transmission. Policy makers in public health should target indoor environments with insufficient ventilation by either mandating improved ventilation or setting a maximum occupancy when the total ventilation supply is fixed.
There is a need to review the “room source and people source” theory that underlies the current ventilation standards, in which a uniform required ventilation rate is specified (corresponding to the “people” component of transmission). This approach effectively results in a lower ventilation rate in crowded spaces and may be inappropriate for respiratory infection control according to the theory developed herein.
1. INTRODUCTION
Significant confusion exists over the transmission route(s) of respiratory infections, as exemplified by the significant variations in the effectiveness of non‐targeted interventions in the on‐going COVID‐19 pandemic. The SARS‐CoV‐2 virus responsible for the pandemic was sequenced within weeks1 after the first outbreak was discovered in Wuhan, China in December 2019. COVID‐19 vaccines have also become available about one year into the pandemic.2 However, the exact transmission routes of SARS‐CoV‐2 remained speculative for a much longer period. The possibility of airborne or aerosol transmission was only recognized by major health authorities3 in September/October 2020, although publications by the Chinese National Health Commission had speculated on this transmission route as early as February 2020.4 WHO5 accepted that short‐range inhalation predominates the transmission SARS‐CoV‐2 in close contact, more than 16 months into the pandemic. The intervention measures implemented in many countries have not been targeted, and indeed, some countries have adopted a blanket “just in case” approach with significant cost to economies and normal life.
Importantly, most SARS‐CoV‐2 transmission occurs indoors, whereas its outdoor transmission is rare.6 If transmission occurs mostly due to close contact, as commonly believed, it is unclear why there should be a difference in the close contact transmission risk between indoor and outdoor settings. Large droplet transmission, which is traditionally believed to be the main mechanism of close contact transmission, is relatively unaffected by the calmness of the background environment, and more by the initial droplet momentum, which governs the spray of the droplets. Hence, the risk of infection due to large droplet transmission should not differ significantly between indoor and outdoor settings. The large droplet transmission route alone, then, cannot explain the observed difference. A recent mechanistic study revealed that short‐range airborne transmission should significantly dominate large droplet transmission.7 The possibility of long‐range airborne transmission has also recently been demonstrated.8
It is therefore natural to ask how short‐ and long‐range airborne transmission are linked. A continuum from short‐ to long‐range transmission could conceivably explain the predominantly indoor infection that has been observed. Room ventilation partly governs the long‐range airborne transmission risk, as described by the Wells‐Riley equation.9 It deserves to be asked whether room ventilation also affects short‐range airborne transmission. One common misconception is that the general ventilation does not affect short‐range airborne transmission.10 This follows the basic idea that expired jets are strong and relatively unaffected by room air flows. This study shows this belief to be untrue. The high risk of transmission by close contact is due to the direct exposure of the susceptible person to the expired jet of the infected person. The exposure from such a jet and the exposure in the rest of the room should be considered simultaneously. This is achieved in this study using a simple mass balance model. In outdoor conditions, the air entrained into the expired jet from the surroundings is mostly free of expired droplet nuclei, in an assumption that the ventilation rate is infinite. In contrast, in an enclosed environment, the surrounding room air contains expired droplet nuclei, the concentration of which depends on the ventilation rate.
2. METHODS
2.1. A mechanistic model of short‐ and long‐range airborne exposure
The short‐range airborne route is defined as exposure by inhalation of expired virus‐containing droplets or aerosols smaller than 50 µm through the mouth or nose of a susceptible person at close range from an infected person. It is also referred to as the short‐range inhalation route. Due to the possibility of relatively large air speeds in an expired puff or jet, much larger droplets or aerosols can be suspended within it than those involved in the long‐range inhalation route. The traditional airborne transmission route is defined as exposure to exhaled fine aerosols or droplet nuclei that contain infectious microbes, such as viruses, that eventually lead to infection. Although such a definition of the airborne transmission route does not rule out the short‐range airborne route, it generally refers to the inhalation of airborne droplet nuclei with diameters of less than 5 µm. In a typical room environment, the air speed is required to be less than 0.2 m/s to avoid a thermal draft.11 In the traditional sense, airborne transmission is generally taken to imply infection at long distances. Below, we consider how this route may also occur at shorter distances.
To develop a simple model that considers both the short‐range and long‐range airborne transmission routes in a room setting, we consider a steady‐state jet with a nozzle of diameter (m) as a model for mouth‐expired flows (see Figure 1). We consider a room environment with a negligible pressure gradient. The momentum flux in the jet is constant in the longitudinal direction.
FIGURE 1.
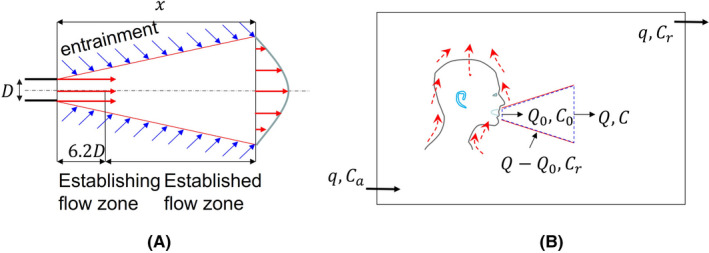
Simple model of the continuum from the short‐range to the long‐range inhalation routes. (A) A simple jet model assuming the expired jet is steady; (B) The jet zone with a variable distance x as shown in (A), and the room zone
The expired airflow rate at the mouth origin is (L/s), and the flow rate in the expired jet increases to (L/s) at a distance due to entrainment. A dilution factor of the jet can be defined as , which is valid at distance .12 For a typical mouth diameter of 20 mm, this means that mm.
We divide the room into two zones, the jet zone ( m) and the room zone (ie, the rest of the room), and the volume of the jet zone is much smaller than the room zone. The choice of 2 m is somewhat arbitrary and may change as more realistic expired‐jet data become available. The 2 m threshold distance seems to work well with our ideal steady jet assumption, while the 1–1.5 m threshold distance works well in realistic conditions.10 Various threshold values have been used as the basis of social (physical) distancing rules during the COVID‐19 pandemic, including 1 m in mainland China, Hong Kong, Denmark, France, and Singapore; 1.5 m in Australia, Belgium, Germany, Greece, Italy, the Netherlands, Portugal, and Spain; and 6 feet or 2 m in the United States, Canada, and the UK.13
Consider exhaled aerosols with average concentration at the jet origin (approximately at the mouth), average concentration within the jet at distance ,12 average concentration in the room zone, and concentration in ambient (outdoor) air. The ventilation rate supplied to the room is (L/s). If virus deactivation is considered, the concentration may alternatively refer to the virus concentration.
The steady‐state mass balance equation for an exhaled aerosol in a jet zone of length x (≤2 m) may be written as follows:
| (1) |
The average exhaled aerosol concentration at distance x can be derived as:
| (2) |
Note that we assume that there is no virus deactivation within the threshold distance of the jet (x < 2 m). Due to droplet evaporation after droplet release from the mouth or nose, the aerosol location must be defined in relation to the release site. All droplet sizes in the short‐range airborne transmission route are defined at the mouth or nose unless otherwise stated. Droplets less than 50 µm in diameter are expected to evaporate to a minimum size within the first 2 s,14 that is, mostly within the expired jet during normal breathing or talking. It is known that deactivation of some bacteria mostly occurs after full evaporation or dehydration.15 There is a lack of data on virus deactivation in relation to droplet evaporation or dehydration.16 It is also known that large droplets mostly settle out of the jet within a distance around 1.5–2 m.17 Droplets smaller than 50 μm are expected to shrink to, e.g. one third of their original sizes after full evaporation18 (eg, 50 µm would become 17 µm). Droplets smaller than 15 µm at the mouth or nose therefore become smaller than 5 µm after full evaporation and can be suspended in the room zone for a sufficiently long time to be involved in long‐range airborne transmission. Droplets between 15 and 50 µm at the origin (ie, 5–17 µm after full evaporation) are expected to settle to the floor within 5–50 min and can therefore only be involved in long‐range airborne transmission for a short while. The exact distance that these intermediate‐size aerosols (15–50 µm) travel depends on the room air flow conditions. In this study, we assume that such aerosol droplets travel between 2 and 3 m from the mouth. The virus deactivation is also assumed to have occurred in this fictitious distance zone.
We defined a new parameter, , as the fraction of infectious viral load, or the fraction of infectious aerosol in the suspended aerosols in the expired jet that remain suspended in the room zone. The size range of the suspended aerosols in the room zone is smaller than that in the jet zone due to difference in the air speeds in the two zones, which means the viral load fraction .
Thus, the macroscopic mass balance equation for the exhaled aerosol concentration in the room zone may be assumed to be as follows:
| (3) |
A full mixing condition is assumed. The full mixing assumption implies that our proposed model may be applied for small‐ to medium‐sized rooms with mixing ventilation. The model is not directly applicable to rooms ventilated by displacement and to large enclosures in which full mixing is likely not expected to be achieved.
Determination of the fraction of the virus in suspended aerosols in the expired jet that remain suspended in the room zone is not easy. When the concentration refers to the viable virus concentration, it depends on the droplet size distribution and the virus concentration in droplets of various sizes. According to the droplet size distribution measured by Duguid in 194619 during talking, and assuming that the virus concentration is identical among all droplet sizes, is estimated to be only 0.03. Such a small value is mainly caused by the assumed existence of infectious large droplets. However, it is also known that for some respiratory infections, the smaller droplets contain most of the virus.20, 21 In case that a virus can also survive well in the airborne aerosols, the viral load fraction can be large.
The average room concentration or the entrained air concentration of exhaled aerosols is as follows:
| (4) |
The ratio is known as the rebreathed fraction.22 The expired flow rate is typically 0.1 L/s at rest. For a typical ventilation rate of 10 L/s per person, (ie, an inhaled breath would contain 1% exhaled breath or a breath dilution ratio of 100 times). The breath dilution ratio β is defined as the reciprocal of the rebreathed fraction.23
Inserting the from equation (4) into the from equation (2), we obtain
| (5) |
At infinite distance, the dilution factor becomes infinity, and according to equation (5), the concentration in the jet becomes C = . This is identical to equation (3). This reflects the nature of the continuity of exposure to respiratory droplets from close range to long range.
If an exhaled tracer substance is considered, such as the carbon dioxide concentration, its increase ( above the ambient or outdoor concentration is shown to be a good indicator of relative exposure to expired droplets by long‐range airborne transmission,22 as also seen from equation (4). Equation (5) suggests that such an approximation may not be valid for short‐range exposure due to moderation of the outdoor concentration by the dilution factor. The outdoor concentration of the exhaled droplets can be safely assumed to be zero in almost all situations (). In the remainder of the paper, the condition is assumed.
For long‐range airborne exposure, when virus deactivation and aerosol deposition are considered, the simple macroscopic equation (3) becomes
| (6) |
where , is the equivalent ventilation rate due to settling of the particles, is the deposition rate (h−1), V is the room air volume (m3), and is the equivalent ventilation rate due to deactivation of the virus. Estimation of and is provided in the Supplementary Information.
Thus, when equation (5) becomes
| (7) |
where .
Only an ideal jet is considered in the simple model. An expired jet can have a very large spread angle because of the mouth's cavity structure and the movement of heat and the body. In that situation, the concentration decay in an expired jet can be more rapid than in an ideal jet. The two major parameters and are determined as follows.
Note that our simple model is presented without validation, but may be easily justified. Several studies have found that the expired flows can be described as a jet, for example.24 The macroscopic governing equation of particle concentration such as equation (5) has been widely used for indoor airborne pollutant analyses. Note also that only one infector is considered in Figure 1 without considering any susceptible. It is also easy to demonstrate that the Figure 1 model can be extended to the situation when there is more than one individual in the room, and all are infectors.
2.1.1. Expired flow rate
Assume that the concentration of occupant‐exhaled pollutants (bio‐effluents) is proportional either to the expired flow rate (m3/min; also referred to as the pulmonary ventilation rate when used with the Wells‐Riley equation) or to the inhalation rate used by US EPA.25
For simplicity, we approximate the expired flow rates for sleep/sedentary, light activity, moderate activity, and intense activity as 0.1, 0.2, 0.3, and 0.6 L/s, respectively (Table 1). The average expired flow rate during moderate activity is approximately three times that during sleep, and that during intense activity is two times that during light activity. It is unknown how the number of expired droplets or the virus concentration vary due to different levels of activity. However, because the mechanisms of exhaled droplet generation are likely mechanical, such as due to vocal fold vibration, bronchiole reopening, or shear stress, we may assume that the number of generated droplets increases accordingly as the expired flow rate increases. However, the exact rate of increase remains unknown.
TABLE 1.
Summary of the combined expired flow rates of men and women of all ages from birth (lowest value) to 81 years or older during various activity levels25
| Activity level | Mean expired flow rate | |
|---|---|---|
| L/min | L/s | |
| Sleep or nap | 3–5.2 | 0.05–0.09 |
| Sedentary/passive | 3.1–5.4 | 0.05–0.09 |
| Light activity | 7.6–13 | 0.13–0.22 |
| Moderate activity | 14–29 | 0.23–0.48 |
| Intense activity | 26–53 | 0.43–0.88 |
The highest value is for young people.
2.1.2. The “people source and room source” rule for determining ventilation rate
In the ASHRAE (2019) standard 62.1,26 the required minimum ventilation rate is estimated as the people outdoor air rate + surface area outdoor air rate , where is the area per occupant. The recommended people and area outdoor air rates are constant, usually at L/s per person and L/s·m2, for a given type of building or function of use. In an office, m2/person, giving a total minimum ventilation rate of 8.5 L/s per person, whereas for a reception area, m2/person, giving a total minimum ventilation rate of 3.5 L/s per person, and for an auditorium seating area, m2/person, so the total minimum ventilation rate is only 2.7 L/s per person. At first sight, these values seem reasonable: as the room surface area per occupant decreases, so does the extent of the non‐human pollutant source; hence, the required ventilation rate per person is also lower. This will be shown to be untrue later for controlling respiratory infection.
2.2. Using expired airflow rate at mouth origin as a reference for considering ventilation rate
The steady‐state equation can be used to calculate when the ventilation rate is the same as the expired airflow rate at the mouth origin; that is, the rebreathed fraction or the room concentration is the same as the concentration at the mouth. The expired flow rate is typically 0.1 L/s during sedentary/passive activity, as shown above. One may consider the following four conditions.
Outdoor air‐like ventilation: the ventilation rate q >> the required value, such as in rooms with large open windows. This is the condition in which the room occupants inhale “fresh” air.
Good or sufficient ventilation: on the order of 10, or L/s per person, that is, sufficiently good ventilation that the air is largely free from the occupants’ exhaled breath.
Poor or insufficient ventilation: L/s per person, but much lower than the minimum required (eg, 5 L/s per person). In this situation, the indoor air is quality is equivalent to the occupants’ immediately exhaled breath.
Very bad or awful ventilation: L/s per person. In this case, the indoor air can be worse than the occupants’ breath.
3. RESULTS
3.1. Exposure to expired gaseous substance at ventilation rate 10 L/s per person and infinite ventilation
We used equation (5) to estimate the expected normalized concentration profiles along the jet length for ventilation rates of 10 L/s per person and an infinite ventilation rate when . The two concentration profiles are very close all the way until at a sufficiently small distance, approximately 6 m. Within such a distance, any further concentration reduction that can be achieved by increasing the ventilation rate beyond 10 L/s is relatively small (Figure 2), which is the well‐known diminishing return phenomenon of ventilation.27, 28 It is also known that at infinite distance, an infinite ventilation would lead to a room average concentration of zero, whereas any finite ventilation would lead to a non‐zero concentration. For an expired flow rate of 0.1 L/s, corresponding to occupants at rest, the rebreathed fraction, with a ventilation rate of 10 L/s per person, whereas the equivalent breath dilution ratio β = 100. Note that we only considered the non‐dimensional concentration normalized against the concentration at the mouth. When the expired flow rates increase to 0.2, 0.3, and 0.6 L/s for light, moderate and intense activity, respectively, the required minimum ventilation rates may need to be increased accordingly. However, estimation of the required minimum ventilation rates at higher activities should consider both the increase of exhalation by the infected and the increase of inhalation by the susceptible. Note that we only considered the non‐dimensional concentration normalized against the concentration at the mouth.
FIGURE 2.
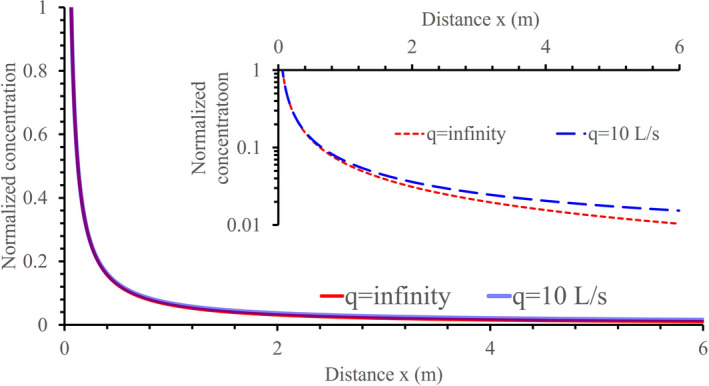
Comparison of the estimated concentration profiles at two ventilation rates, 10 L/s per person and infinite. A viral load fraction γ = 0.5 is used. The inhalation rate adopted is 0.1 L/s, for a resting or sedentary infector
3.2. Short‐range inhalation exposure
The diminishing return phenomenon is demonstrated here in that the difference in concentration within the ventilation rate range of 6–10 L/s per person is much smaller than that for 1–5 L/s per person (Figure 3A or Figure 4). This suggests that a general ventilation rate of 5 L/s may be considered the minimum standard. The choice of 5 L/s or 10 L/s or between these two values depends on the sensitivity of the occupants and the need for good or better indoor air quality. Note that the discussion here focuses on the potential exposure to exhaled substances. The long‐range concentration associated with a 1 L/s ventilation will be similar to that at a distance of 1.2 m with 10 L/s ventilation. Insufficient ventilation increases the risk of both long‐range and short‐range inhalation infection. As expected, a small viral load fraction, for example, γ = 0.1 would lead to less impact of ventilation on short‐range inhalation infection (Figure 3B).
FIGURE 3.
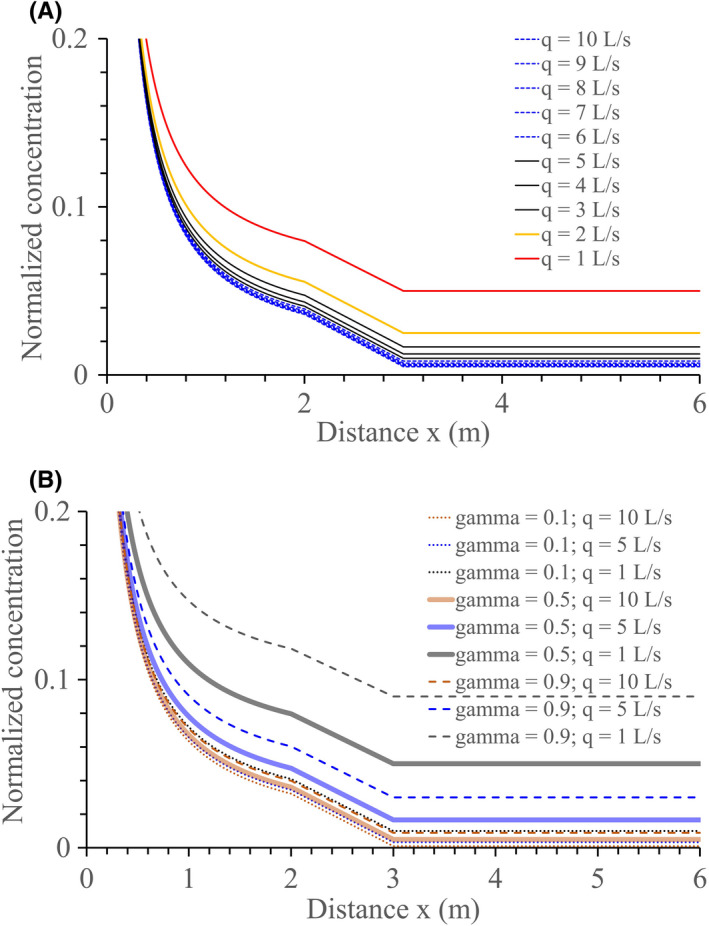
Estimated change of the average concentration of the exhaled aerosols normalized by the concentration at the mouth as a function of distance from the mouth along the expired jet. (A) at 1–10 L/s per person ventilation rates and the viral load fraction γ = 0.5. (B) at 1, 5 and 10 L/s per person ventilation rates and three viral load values: γ = 0.1, γ = 0.5 and γ = 0.9. The 2–3 m fictitious zone is assumed to be the distance range within which droplets of size 15–50 µm at the origin or 5–17 µm after full evaporation finally settle. A simple interpolation method is used to draw the lines in the 2–3 m zone
FIGURE 4.
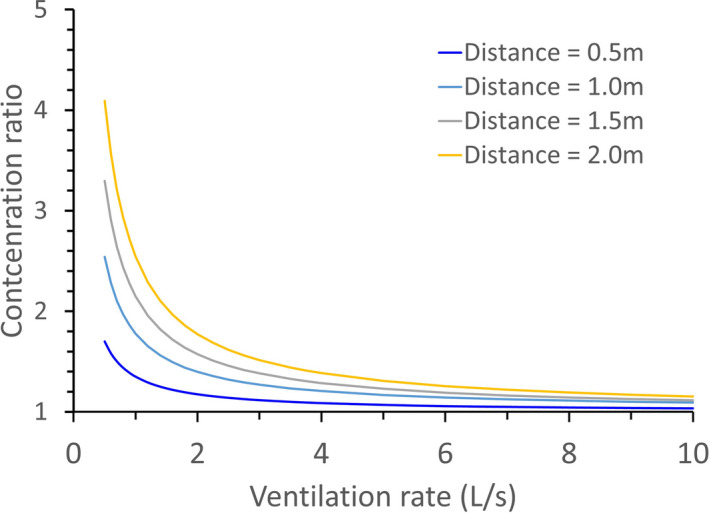
Ratio of the concentration of exhaled aerosols at different ventilation rates to that at an infinite ventilation rate (ie, outdoor conditions) at four distances (0.5, 1, 1.5, and 2 m) from the source. A viral load fraction γ = 0.5 is used
The effect of ventilation on short‐range airborne exposure may be seen from the 0.5, 1.0, 1.5, and 2 m concentration at different ventilation rates. At a ventilation rate of 10 L/s per person, the exhaled aerosol concentration at 0.5 m from the source is close to that at infinite ventilation rates, but at 1 L/s per person, the value is 70% greater (Figure 4). The room ventilation rate affects not only the infection risk due to long‐range inhalation, but also that due to short‐range inhalation. The effect of general ventilation on the short‐range range inhalation route originates from the fact that the expired jet is significantly diluted by entrainment air. Following the dilution factor equation , an expired jet is diluted 16 times at a distance of 1 m, 24 times at 1.5 m, and 32 times at 2 m. The entrainment air is the air from the rest of the room, the quality of which is governed by general ventilation. Again, the diminishing return phenomenon is demonstrated here in that the concentration ratio within the ventilation rate range of 6–10 L/s per person is much smaller than that for 1–5 L/s per person at all four distances shown in Figure 4. The above conclusion is valid for steady‐state and full mixing conditions.
4. REQUIRED MINIMUM VENTILATION RATES AT DIFFERENT INTER‐PERSONAL DISTANCES
The simple model allows an estimate of the required ventilation when people are in different close contact distance. Such an estimate can be difficult because the dose threshold, the expired number of infectious droplets, and the number of viruses in each droplet are unknown. The following approach is adopted.
First, a tracer gas concept (without any deposition and deactivation, ie, ) is used to calculate the required ventilation to control human odor because some data exist for this method.29, 30, 31 These earlier studies assumed that body odor beyond close contact (eg, assuming a 1.5 m threshold distance) can be controlled by a certain ventilation rate. The literature offers several values of the required minimum ventilation rate per person, that is, 2.5 L/s per person according to ASHRAE 62.126 for most settings, and 10 L/s per person in general, whereas 5 L/s per person may be deduced from Figure 3A.
Next, using equation (5), we set , where is the concentration ratio at a distance of 1.5 m at each of the above‐mentioned ventilation rates. The required rebreathed fraction can then be estimated at various physical distances between people, which is then used to calculate the required ventilation if the expired airflow rate at the mouth origin is known, and we still use 0.1 L/s for typical sedentary at‐rest conditions. Our estimated required ventilation rates are compared with those in the literature32 in Figure 5.
FIGURE 5.
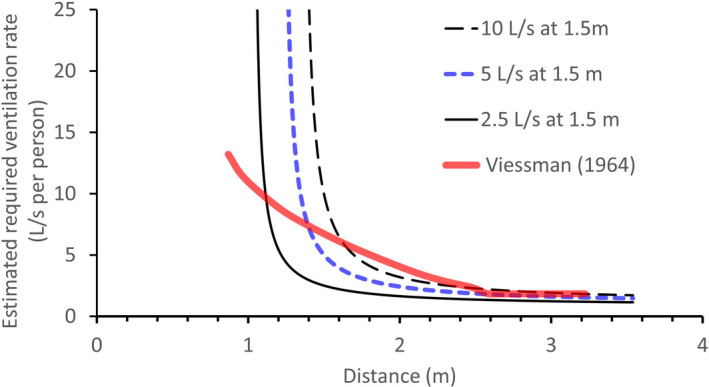
Estimated required ventilation rates at different distances between people if the required ventilation at the threshold distance 1.5 m between people is known as 10, 5, or 2.5 L/s. A viral load fraction γ = 0.5 is used. The consolidated values by Viessman32 are also shown for comparison. The estimated required ventilation rates increase as the distance between people reduces from 2 m, as shown by both our estimation and that by Viessman32
Two observations can be made. First, as the distance decreases from 2 m, a rapid rise is seen in the required ventilation. There also exists a threshold distance below which general ventilation cannot be used to control short‐range exposure. Second, the existing data32 also show an increase in the required ventilation rate as the distance decreases from 2.5 m. Note that in,32 no information was given on the physical distance between people, but rather on the space (m3) per person, which for this study (Figure 5) was translated into a physical distance between occupants assuming a typical room height of 3 m. Interestingly, the estimated required ventilation rate per person becomes prohibitively high when the distance between two people is smaller than a threshold distance.
5. DISCUSSION
5.1. Continuity of short‐range and long‐range airborne transmission: importance of ventilation
The most important insight from the analysis of the simple model is probably that the long‐range airborne transmission of respiratory infection is a continuation of the short‐range airborne transmission, in other words, the short‐ and long‐range airborne transmission modes lie along a continuum (Figure 6). Using the outdoor setting as a reference, our continuum model reveals for the first time that insufficient ventilation leads to the worsening of not only long‐range airborne transmission, which is well known, but also short‐range airborne transmission. This finding also explains the observed phenomenon that transmission of SARS‐CoV‐2 mostly occurs indoors and that its transmission in outdoor settings is rare. However, this does not mean that outdoor settings are always transmission free. One may envisage that when the number of expired droplets significantly increases due to highly intense physical activities, the exposure level within close range of the source patient in outdoor settings will be comparable to that under sleeping/resting conditions indoors, and thus, the associated close contact infection risk may also be high. Outdoor infection risk could also exist when people are in very close physical contact.
FIGURE 6.
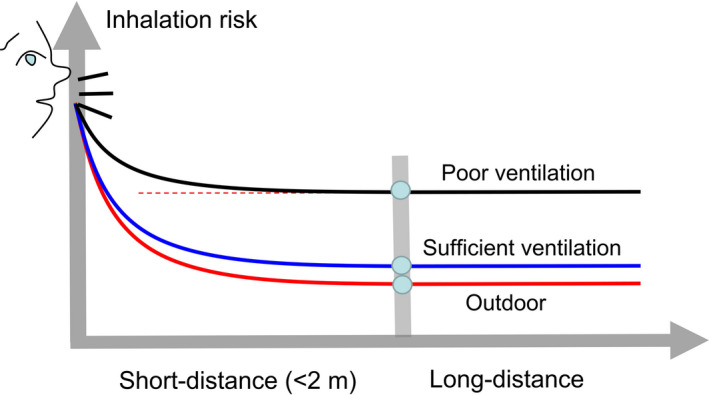
Graphical illustration of the impact of ventilation on short‐ and long‐range airborne transmission of respiratory infection, including under outdoor conditions
The finding of the exacerbation of close contact transmission via the short‐range airborne route in poorly ventilated indoor settings has significant implications for intervention measures in the ongoing COVID‐19 pandemic. Although close contact has been found to play the major role in SARS‐CoV‐2 transmission, our study reveals that the extent of short‐range inhalation exposure during close contact is not uniform across indoor settings, but depends on ventilation. Rooms should be sufficiently ventilated according to their occupancy, or a maximum occupancy should be applied in room settings with a limited ventilation rate. The maximum occupancy can be determined either by measuring the ventilation rate or by real‐time monitoring of a ventilation indicator, such as the CO2 concentration. A maximum CO2 concentration of 900–1000 ppm should be used for passive or sedentary activities, and lower value should be used for higher activities.
The realization of the effect of general ventilation on the short‐range inhalation transmission of an infectious disease has at least two useful implications. First, in cases in which the contribution of the short‐range inhalation route is significant, as shown by a recent mechanistic study,7 the effect of general ventilation on respiratory infection is more important than traditionally believed. Intervention policies should focus on poorly ventilated indoor environments. Second, there is a need to compare general and personalized ventilation strategies with respect to effectiveness and economics. General ventilation is easier to implement but is likely to be more energy‐intensive than personalized ventilation,33 whereas the latter can be highly effective but difficult to implement, particularly when people are in movement.
5.2. An alternative explanation for the convergence of ventilation standards to 10 L/s per person
At this point, it is appropriate to ask what a sufficient ventilation rate should be for respiratory infection control. This is perhaps the most fundamental question in building ventilation. Note that ventilation standards, such as ASHRAE62.1,26 typically do not include infection control as their objective. However, commonly recommended minimum ventilation rates for environments such as offices are around 8–10 L/s per person. Based on empirical data, Fanger27, 28 suggested that further increases in the ventilation rate beyond 10 L/s per person provide relatively little benefit. Our results provide an alternative explanation of this standard range based on the indoor exposure to expired gaseous substances as compared with outdoor settings, where the ventilation rate may be assumed to be very large or infinite. Assuming that the risk of respiratory infection due to close contact is minimized in outdoor settings, then the outdoor close contact scenario is a possible reference for exploring indoor close contact settings. The diminishing return phenomenon beyond 10 L/s suggests that 10 L/s per person is a good minimum ventilation rate standard. The results in Figures 3 and 4 suggest that 5 L/s per person may also be sufficient under some conditions considering the diminishing return principle. For higher activities, the required ventilation rates need to be increased accordingly.
The effect of particle deposition and virus deactivation can be easily included in the model for long‐range inhalation by replacing the ventilation rate with an effective ventilation rate that includes the effect of general ventilation, settling, and deactivation. However, for simplicity, we did not separate out the effect of deposition in the above analysis. According to Miller et al.,34 the deposition rate for the aerosols concerned can be 0.3–1.5 h−1, which is close to the values estimated in Supplementary Information, while the virus deactivation rate can be 0–0.63 h−1. These values can be converted into effective ventilation rates when the room air volume is known. We consider three room air volumes per person: crowded (3 m3 per person), relatively sparse (30 m3 per person), and sparse (300 m3). We further assume that the air in such space is fully mixed. Considering an average deposition of 1 h−1, the corresponding effective ventilation rates are 0.83, 8.3, and 83 L/s per person. Considering a required minimum ventilation rate of 10 L/s per person, these estimated effective ventilation rates suggest that the relative importance of deposition and deactivation at a steady state is low in crowded settings, but significant in sparse settings. The estimated 83 L/s per person in the sparse setting may be achieved by providing good internal circulation so that aerosol particles smaller than 5 µm are fully mixed in the space and the expected deposition effect takes place.
5.3. Our findings challenge the “room source and people source” theory in the current ventilation standard
Three major studies form the basis of current ventilation standards: by Yaglou in 1936,29 Cain et al. in 1983,30 and Berg‐Munch et al. in 1986.31 Yaglou29 showed that if the air space is less than 600–700 ft3/person (corresponding to an approximately 2 m distance between people, assuming a ceiling height of 3 m), the required minimum ventilation rate increases as the air space or inter‐personal distance decrease. This makes sense in that within a crowded environment, when the distance between two people is less than 1.5 m, close contact exposure is important, as shown above. Although a cleaner background environment would dilute jet‐expired droplets more fully, as people became closer than 1.5 m apart, a higher ventilation rate would be needed. In contrast, both Cain et al.30 and Berg‐Munch et al.31 argued that the ventilation rate should remain constant per person regardless of the occupant density, on the basis that the source strength of body odor was found to be independent of the occupant density. These latter two studies adopted a new approach of using short‐term visitors to the room, who only sensed the room average concentration, rather than reflecting the longer‐term occupants’ realistic sense of the environment. Their data supported the dominant “room source and people source” theory in the current influential ASHRAE 62.1.26 This simple theory suggests that a crowded environment requires a lower ventilation rate because each person has a smaller room area while the people component remains constant. Our simple model and the consolidated data in Ref. [32] clearly showed that the assumption that the people component remains constant is incorrect. Our analysis thus supports the data of Yaglou,29 but not those of Cain et al.30 or Berg‐Munch et al.,31 the latter two of which miss the important route of exposure by short‐range inhalation. Our theory suggests that the minimum required ventilation rate increases as the physical distance between people decreases below 2 m.
5.4. Limitation of the study
There are at least two major groups of limitations in this study. First, a full mixing room condition is assumed, with an ideal steady expired jet, while in realistic settings, the flow might not be fully mixed in a room; the expired flows are intermittent in nature. The full mixing assumption means that the model is only applicable to rooms in which complete mixing ventilation is applied, but not in displacement ventilation where stratification exists35, 36 or in large enclosures where separate airflow zones may exist. The assumption of the steady expired jet means that the short‐range dilution might not be well predicted. Not only the full mixing assumption, our adopted ideal jet model also does not apply to displacement‐ventilated rooms where thermal stratification exists.37 Our discussion on outdoor exposure scenarios assumes an infinite ventilation rate. Calm conditions can indeed be experienced outdoors. The expired jet can also travel far when stable stratified layer exists at night conditions.38 Inherently built in our simple model, a steady‐state condition has been assumed. In some indoor spaces such as classrooms and public transport, short‐duration occupancy is common without reaching their steady‐state condition. In these realistic conditions, more complex approaches such as computational fluid dynamics and full‐scale field studies might be used, and a transient analysis is needed in the future.
Second, our simple model cannot fully consider the effects of deposition, deactivation, and evaporation. Because only the inhalation range of aerosol sizes is considered in the simple model, we must assume that the effects of particle deposition and virus deactivation are minimal at short range. The assumption that virus deactivation mostly occurs in the distance range just beyond that of short‐range transmission may not be valid, as it is also known that evaporation or dehydration are associated with deactivation of microbes.15 Droplets smaller than 50 µm mostly evaporate within the expired jet,14 and very small droplets tend to fully evaporate very close to the mouth. It takes only 0.26 s for a 20‐µm droplet to fully evaporate to its final equilibrium size at 0% relative humidity and 1.7 s for a 50‐µm droplet. Hence, it is likely that most microbes are deactivated within the close range rather than at the edge of the close range; however, the deactivation rate and its variation within such a short time scale remain unknown. Lack of data on the viral load in different expired droplet sizes is another major challenge. Hence, a constant viral load fraction is used in this study. Further studies are needed to determine the reliable values for the newly defined parameter of viral load fraction for different respiratory infection, which is the key parameter for the continuation of short‐ and long‐range airborne transmission. Treatment of evaporation effects in a simple jet model has been considered.7 Tools such as computational fluid dynamics can also be used to simulate the effects of evaporation.
6. CONCLUSIONS
A simple macroscopic continuum model that links short‐ and long‐range airborne transmission is developed. In contrast to traditional belief, the room ventilation rate is shown to significantly affects the short‐range airborne exposure. A ventilation rate of 10 L/s per person provides a similar concentration vs distance decay profile to that in outdoor settings. This result provides an alternative explanation of the 10 L/s per person standard range for rest or sedentary conditions based on the indoor exposure to expired gaseous substances as compared with outdoor settings. When the ventilation rate in a room is insufficient, the airborne infection risks due to both short‐ and long‐range transmission are high. Finally, our findings challenge the “room source and people source” theory in the current ventilation standard without considering the inter‐personal physical distance. Instead, it is necessary to increase the ventilation rate when the physical distance between people is less than approximately 2 m.
CONFLICT OF INTEREST
There is no conflict of interest.
AUTHOR CONTRIBUTION
Yuguo LI: Conceptualization; Study design; Model development and analyses; Original draft and editing; and Funding acquisition. Pan CHENG: Model analyses; and Review and editing. Wei JIA: Data analysis; and Review and editing.
PEER REVIEW
The peer review history for this article is available at https://publons.com/publon/10.1111/ina.12946.
Supporting information
Supplementary Material
ACKNOWLEDGMENT
This work was supported by the Hong Kong RGC GRF project (no 17202719).
Li Y, Cheng P, Jia W. Poor ventilation worsens short‐range airborne transmission of respiratory infection. Indoor Air. 2022;32:e12946. 10.1111/ina.12946
REFERENCES
- 1. World Health Organization . Novel Coronavirus (2019‐nCoV): situation report 1. 2020. https://apps.who.int/iris/handle/10665/330760 Accessed on 15 November 2020.
- 2. Buckner JH, Chowell G, Springborn MR. Dynamic prioritization of COVID‐19 vaccines when social distancing is limited for essential workers. Proc Natl Acad Sci. 2021;118(16):e2025786118. [DOI] [PMC free article] [PubMed] [Google Scholar]
- 3. World Health Organization . Coronavirus disease (COVID‐19): How is it transmitted? 2020. https://www.who.int/news‐room/q‐a‐detail/coronavirus‐disease‐covid‐19‐how‐is‐it‐transmitted Accessed on 15 November 2020.
- 4. National Health Commission . New Coronavirus Pneumonia Prevention and Control Plan. 5th ed. Accessed at www.nhc.gov.cn on 27 February 2020.
- 5. World Health Organization . 2021. Coronavirus disease (COVID‐19): How is it transmitted? Updated 30 April 2021. https://www.who.int/news‐room/q‐a‐detail/coronavirus‐disease‐covid‐19‐how‐is‐it‐transmitted. Last assessed May 22, 2021.
- 6. Qian H, Miao T, Liu L, Zheng X, Luo D, Li Y. Indoor transmission of SARS‐CoV‐2. Indoor Air. 2021;31(3):639‐645. [DOI] [PubMed] [Google Scholar]
- 7. Chen W, Zhang N, Wei J, Yen HL, Li Y. Short‐range airborne route dominates exposure of respiratory infection during close contact. Build Environ. 2020;176:106859. [Google Scholar]
- 8. Morawska L, Milton DK. It is time to address airborne transmission of coronavirus disease 19 (Covid‐19). Clin Infect Dis. 2020;71(9):2311‐2313. [DOI] [PMC free article] [PubMed] [Google Scholar]
- 9. Riley EC, Murphy G, Riley RL. Airborne spread of measles in a suburban elementary school. Am J Epidemiol. 1978;107(5):421‐432. [DOI] [PubMed] [Google Scholar]
- 10. Liu L, Li Y, Nielsen PV, Jensen RL, Wei J. Short‐range airborne transmission of expiratory droplet between two people. Indoor Air. 2017;27(2):452‐462. [DOI] [PubMed] [Google Scholar]
- 11. American Society of Heating, Refrigerating and Air‐Conditioning Engineers (ASHRAE) . Thermal Environmental Conditions for Human Occupancy. ASHRAE Standard 55, 2013. [Google Scholar]
- 12. Lee JHW, Chu VH. Turbulent jets and plumes: a Lagrangian approach. Boston, MA: Kluwer Academic Publishers; 2003. [Google Scholar]
- 13. Scientific Advisory Group for Emergencies . Transmission of SARS‐CoV‐2 and Mitigating Measures EMG‐SAGE 4th June. 2020. https://www.gov.uk/government/publications/transmission‐of‐sars‐cov‐2‐and‐mitigating‐measures‐update‐4‐june‐2020. Accessed on 23 August, 2021.
- 14. Wei J, Li Y. Enhanced spread of expiratory droplets by turbulence in a cough jet. Build Environ. 2015;93(2):86‐96. [Google Scholar]
- 15. Xie X, Li Y, Zhang T, Fang HHP. Bacterial survival in an evaporating deposited droplet on a Teflon‐coated surface. Appl Microbiol Biotechnol. 2006;73(3):703‐712. [DOI] [PMC free article] [PubMed] [Google Scholar]
- 16. Marr LC, Tang JW, Van Mullekom J, Lakdawala SS. Mechanistic insights into the effect of humidity on airborne influenza virus survival, transmission and incidence. J R Soc Interface. 2019;16(150):20180298. [DOI] [PMC free article] [PubMed] [Google Scholar]
- 17. Xie X, Li Y, Chwang AT, Ho PL, Seto WH. How far droplets can move in indoor environments‐‐revisiting the Wells evaporation‐falling curve. Indoor Air. 2007;17(3):211‐225. [DOI] [PubMed] [Google Scholar]
- 18. Liu L, Li Y, Wei J, Ooi A. Evaporation and dispersion of respiratory droplets from coughing. Indoor Air. 2017;27:179‐190. [DOI] [PubMed] [Google Scholar]
- 19. Duguid J. The size and the duration of air‐carriage of respiratory droplets and droplet‐nuclei. Epidemiol Infect. 1946;44(6):471‐479. [DOI] [PMC free article] [PubMed] [Google Scholar]
- 20. Milton DK, Fabian MP, Cowling BJ, Grantham ML, McDevitt JJ. Influenza virus aerosols in human exhaled breath: particle size, culturability, and effect of surgical masks. PLOS Pathog. 2013;9(3):e1003205. [DOI] [PMC free article] [PubMed] [Google Scholar]
- 21. Yan J, Grantham M, Pantelic J, et al. Infectious virus in exhaled breath of symptomatic seasonal influenza cases from a college community. Proc Natl Acad Sci USA. 2018;115(5):1081‐1086. [DOI] [PMC free article] [PubMed] [Google Scholar]
- 22. Rudnick SN, Milton DK. Risk of indoor airborne infection transmission estimated from carbon dioxide concentration. Indoor Air. 2003;13(3):237‐245. [DOI] [PubMed] [Google Scholar]
- 23. Jiang Y, Zhao B, Li X, Yang X, Zhang Z, Zhang Y. Investigating a safe ventilation rate for the prevention of indoor SARS transmission: An attempt based on a simulation approach. Build Simul. 2009;2(4):281‐289. [DOI] [PMC free article] [PubMed] [Google Scholar]
- 24. Abkarian M, Mendez S, Xue N, Yang F, Stone HA. Speech can produce jet‐like transport relevant to asymptomatic spreading of virus. Proc Natl Acad Sci USA. 2020;117(41):25237‐25245. [DOI] [PMC free article] [PubMed] [Google Scholar]
- 25. U.S. EPA . Exposure Factors Handbook – Chapter 6: Inhalation rates. 2011. https://ofmpub.epa.gov/eims/eimscomm.getfile?p_download_id=526167. Accessed on 28 November 2020.
- 26. American Society of Heating, Refrigerating and Air‐Conditioning Engineers (ASHRAE) . Ventilation for acceptable indoor air quality. ASHRAE Standard 62.1, 2019. [Google Scholar]
- 27. Fanger PO. Introduction of the olf and the decipol units to quantify air pollution perceived by humans indoors and outdoors. Energy Build. 1988;12(1):1‐6. [Google Scholar]
- 28. Fanger PO. Indoor air quality in the 21st century: search for excellence. Indoor Air. 2000;10(2):68‐73. [DOI] [PubMed] [Google Scholar]
- 29. Yaglou CP. Ventilation requirements. ASHVE Trans. 1936;42:133‐162. [Google Scholar]
- 30. Cain WS, Leaderer BP, et al. Ventilation requirements in buildings. Atmos Environ. 1983;17(6):1183‐1197. [Google Scholar]
- 31. Berg‐Munch B, Clausen G, Fanger PO. Ventilation requirements for the control of body odor in spaces occupied by women. Environ Int. 1986;12(1–4):195‐199. [Google Scholar]
- 32. Viessman W. Ventilation control of odor. Ann NY Acad Sci. 1964;116:630‐637. [DOI] [PubMed] [Google Scholar]
- 33. Bolashikov ZD, Melikov AK. Methods for air cleaning and protection of building occupants from airborne pathogens. Build Environ. 2009;44(7):1378‐1385. [DOI] [PMC free article] [PubMed] [Google Scholar]
- 34. Miller SL, Nazaroff WW, Jimenez JL, et al. Transmission of SARS‐CoV‐2 by inhalation of respiratory aerosol in the Skagit Valley Chorale superspreading event. Indoor Air. 2020;31(2):314‐323. [DOI] [PMC free article] [PubMed] [Google Scholar]
- 35. Nielsen PV, Olmedo I, de Adana MR, Grzelecki P, Jensen RL. Airborne cross‐infection risk between two people standing in surroundings with a vertical temperature gradient. HVAC&R Res. 2012;18(4):552‐561. [Google Scholar]
- 36. Olmedo I, Nielsen PV, Ruiz de Adana M, Jensen RL. The risk of airborne cross‐infection in a room with vertical low‐velocity ventilation. Indoor Air. 2013;23(1):62‐73. [DOI] [PubMed] [Google Scholar]
- 37. Liu F, Qian H, Luo Z, Zheng X. The impact of indoor thermal stratification on the dispersion of human speech droplets. Indoor Air. 2021;31(2):369‐382. [DOI] [PubMed] [Google Scholar]
- 38. Stull RB. An introduction to boundary layer meteorology. Dordrecht, The Netherlands: Kluwer Academic Publishers; 1988. [Google Scholar]
Associated Data
This section collects any data citations, data availability statements, or supplementary materials included in this article.
Supplementary Materials
Supplementary Material