

Abstract
The effect of lockdown due to coronavirus disease (COVID-19) pandemic on air pollution in four Southern European cities (Nice, Rome, Valencia and Turin) and Wuhan (China) was quantified, with a focus on ozone (O3). Compared to the same period in 2017–2019, the daily O3 mean concentrations increased at urban stations by 24% in Nice, 14% in Rome, 27% in Turin, 2.4% in Valencia and 36% in Wuhan during the lockdown in 2020. This increase in O3 concentrations is mainly explained by an unprecedented reduction in NOx emissions leading to a lower O3 titration by NO. Strong reductions in NO2 mean concentrations were observed in all European cities, ~53% at urban stations, comparable to Wuhan (57%), and ~65% at traffic stations. NO declined even further, ~63% at urban stations and ~78% at traffic stations in Europe. Reductions in PM2.5 and PM10 at urban stations were overall much smaller both in magnitude and relative change in Europe (~8%) than in Wuhan (~42%). The PM reductions due to limiting transportation and fuel combustion in institutional and commercial buildings were partly offset by increases of PM emissions from the activities at home in some of the cities. The NOx concentrations during the lockdown were on average 49% lower than those at weekends of the previous years in all cities. The lockdown effect on O3 production was ~10% higher than the weekend effect in Southern Europe and 38% higher in Wuhan, while for PM the lockdown had the same effect as weekends in Southern Europe (~6% of difference). This study highlights the challenge of reducing the formation of secondary pollutants such as O3 even with strict measures to control primary pollutant emissions. These results are relevant for designing abatement policies of urban pollution.
Keywords: Air quality, Ozone, Coronavirus, Lockdown, Risk assessment
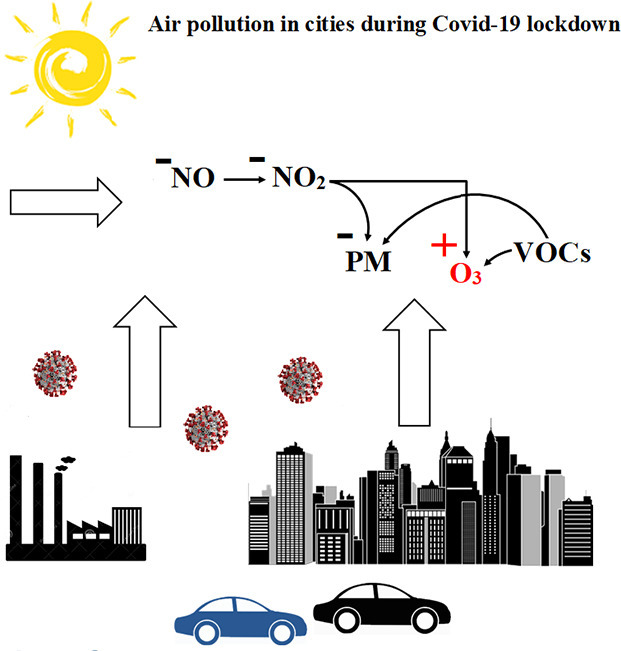
Graphical abstract
Highlights
- •
Air quality during the COVID-19 lockdown in 4 European and 1 Chinese cities
- •
The lockdown caused a substantial reduction in NOx in all cities (~ 56%)
- •
Reductions in PM were much higher in Wuhan (~ 42%) than in Europe (~ 8%)
- •
The lockdown caused an ozone increase in all cities (17% in Europe, 36% in Wuhan)
- •
The lockdown effect on O3 production was higher than the weekend effect
1. Introduction
Nowadays, 55% of the world population lives in urban areas (United Nations, 2019). Outdoor air pollution is a major global public health issue (Lelieveld et al., 2015), leading to 4.2 million premature deaths worldwide in 2016 (WHO, 2019). In cities, particulate matter with an aerodynamic diameter lower than 2.5 μm and 10 μm (PM2.5 and PM10), nitrogen dioxide (NO2) and tropospheric ozone (O3) are among the most threatening air pollutants in terms of harmful effects on human health associated with respiratory and cardiovascular diseases and mortality (Weinmayr et al., 2010; Pascal et al., 2013; Stafoggia et al., 2013; Cohen et al., 2017; Nuvolone et al., 2018). As a result, the legislated ambient air quality standards and the emission control policies around the world (e.g. World Health Organization Air Quality Guidelines, 2006; European Council Directive 2008/50/EC, Ministry of Environmental Protection, 2012; National Emission Ceilings Directive (2016/2284/EU); Convention on Long-range Transboundary Air Pollution, 2017) regulate air pollutants concentrations such as PM2.5, PM10, NO2 and O3, by setting limit and target values, long-term objectives, information thresholds, and alert threshold values for the protection of human health (Table 1 ).
Table 1.
Air quality standards and limit values (in μg.m−3) established by the European Commission in Europe (Directive 2008/50/EC) and the Ministry of Environmental Protection in China (2012), as well as the World Health Organization Air Quality Guidelines (2006) for the human health protection in urban areas.
| Averaging time | EC (2008) | MEP (2012) | WHO (2006) | |
|---|---|---|---|---|
| PM2.5 | Annual mean | 25 | 35 | 10 |
| 24-hour mean | – | 75 | 25 | |
| PM10 | Annual mean | 40 | 70 | 20 |
| 24-hour mean | 50 (×35⁎) | 150 | 50 | |
| NO2 | Annual mean | 40 | 40 | 40 |
| 1-hour mean | 200 (×18) | 200 | 200 | |
| O3 | Daily 8-hour maximum | 120 (×25) | 160 | 100 |
Not to be exceeded >35 times a year.
In Europe, despite successful legislation implemented over several decades, and success in reducing air pollutants emissions, the current air pollution levels continue to cause important impacts on human health by exceeding the EU standards and the WHO Air Quality Guidelines for the protection of health (Guerreiro et al., 2014; De Marco et al., 2018; Sicard et al., 2019). In 2015, 47,300, 84,300 and 38,600 non-accidental premature deaths were attributed to air pollution (PM2.5, NO2, O3) in France, Italy and Spain, respectively (EEA, 2018). In 2016, the total number of premature deaths for non-accidental causes attributed to PM2.5 and PM10 (above 10 μg.m−3) and O3 (above 20 μg.m−3) was 1800 in Rome and 144 in Nice (Sicard et al., 2019). Moreover, in a study of nine European cities including Rome and Valencia, the percentage increase in all deaths from natural causes per °C increase in air temperature tended to be greater during high O3 days (Analitis et al., 2018), suggesting interactions with climate change. Air pollution in China has been a rising threat to human health (Liu et al., 2016; Feng et al., 2019) with annually about 2.5 million premature deaths attributed to air pollution (Lelieveld et al., 2015). Based on WHO metrics for human health protection, the O3 levels led to 59,844 additional deaths in 2015 across China (Feng et al., 2019). In Wuhan, a total of 19,948 deaths were attributed to PM10, NO2 and SO2 over the time period 2007–2009 (Ren et al., 2017).
Tropospheric O3 formation occurs when NOx and volatile organic compounds (VOCs) react in the atmosphere in the presence of sunlight (Seinfeld and Pandis, 1998). Despite control efforts, the rising O3 levels become a major public health concern in cities worldwide (Paoletti et al., 2014; Sicard et al., 2018; Lefohn et al., 2018). The O3 background levels are significantly rising at urban stations in Nice (+ 0.30 ppb per year), Rome (+ 0.49 ppb per year) and Valencia (+ 1.21 ppb per year) since 2005 (Sicard et al., 2013, Sicard et al., 2018). In China, following the implementation of Air Quality Standards in 2012 (Ministry of Environmental Protection, 2012), a network of ground stations became operational in 2013. Some studies showed an O3 increase in cities, e.g. maximum daily 8-hour average O3 concentrations increased by on average 0.46 ppb per year in 74 cities across China from 2013 to 2017 (Liu et al., 2018; Liu and Wang, 2020). The ground-level O3 is considered one of the most harmful air pollutants in terms of effects on human health (e.g. respiratory and cardiovascular systems), vegetation and materials (Mills et al., 2011; WHO, 2013; Sicard et al., 2016a, Sicard et al., 2016b; Nuvolone et al., 2018; Sicard et al., 2019).
The surface O3 concentrations tend to be higher on the weekends (Saturday and Sunday) compared to the weekdays (Monday to Friday) at urban sites, despite lower emissions of NOx, VOCs and PM. This “weekend effect” has been widely studied worldwide (e.g. Qin et al., 2004; Jiménez et al., 2005; Blanchard et al., 2008; Schipa et al., 2009; Wolff et al., 2013; Adame et al., 2014; Shen et al., 2014; Diéguez et al., 2014; Xie et al., 2016; Zou et al., 2019; Sicard et al., 2020). Observations of how O3 formation responds to emissions reduction provide an insight into the effectiveness of policies to plan future suitable strategies for reducing emissions of O3 precursors (Karl et al., 2017).
Due to the coronavirus disease (COVID-19) pandemic, lockdown measures were implemented in China, Italy, Spain and France to limit social contacts and flatten the epidemic curve. Such measures were implemented from 23rd January 2020 in Wuhan, China, while in Italy, the measures were first applied in Northern regions (from 8th March 2020), where first COVID-19 cases were reported, before to be extended to the whole country from 10th March 2020. Tightened restrictive measures (i.e., close of schools and non-essential businesses, limitation of motorized transports) were fully implemented nationwide from 10th March 2020 in Italy, 14th March 2020 in Spain and 18th March 2020 in France, where schools were closed from 16th March 2020.
Plenty of newspapers and other mass media promoted that air pollution levels significantly dropped in major global cities since the lockdown measures, for instance NO2 levels fell by up to 60% in cities relative to the same period in 2019 in the United Kingdom (BBC news, 8 April 2020) and PM2.5 decreased by 60% in New Delhi from 23rd March to 13th April compared to the same period in 2019 (CNN, 23 April 2020). The NO2 pollution over New York (USA) was 30% lower in March 2020, compared to the monthly average from 2015 to 2019 (The Conversation, 15 April 2020). Measurements performed by the European Space Agency (Sentinel-5P satellite) showed that between late January and early February 2020, NO2 levels over cities in Asia and Europe were reduced by 40–50% compared to the same period in 2019 (ESA, 16th April 2020). In parallel with a reduction of the levels of some pollutants (e.g. black carbon, NO2, PM), in Barcelona (Spain) it was also observed that O3 increased (Tobías et al., 2020). Due to the complex chemistry of the atmosphere, there are still open questions regarding air pollution formation and spatiotemporal patterns during the lockdown.
Most of studies are based on the mean biases from the lockdown period (March–April 2020) compared to the same period in 2019, which are subject to the fluctuations in emissions and meteorological conditions. Here, we analyze short-term changes at 36 urban stations in Nice (France), Rome and Turin (Italy), Valencia (Spain) and Wuhan (China) from 1st January 2017 until 18th April 2020. Our aim was to detect and quantify the lockdown effect on the levels of the most health-threatening air pollutants in cities (NOx, PM2.5, PM10, and O3 in particular). We hypothesized that air pollution in the cities is mainly due to local urban emissions and that a 3-year time-series of data is long enough to more reliably detect short-term changes within time series, likely due to short-term emissions changes (e.g. PM, NOx). We also expected an O3 increase in cities due to a lower NO titration.
2. Materials and methods
2.1. Description of study areas
Five cities were selected to have a spatial representativeness and larger air pollution gradients for NO2, PM2.5, PM10 and O3: Rome and Turin in Italy, Nice in France, Valencia in Spain, and Wuhan in China (Fig. 1 ).
Fig. 1.

Location of the air quality monitoring stations in China (Wuhan), France (Nice), Italy (Turin and Rome) and Spain (Valencia).
The COVID-19 outbreak was firstly identified in Wuhan (Central China) in December 2019 (WHO, 2020). Wuhan, capital city of Hubei province, has a total area of 1530 km2 and a population of 8.8 million; Wuhan is the ninth most populous city in China. The climate is humid subtropical with abundant rainfall in summer. The annual mean air temperature is 17.1 °C (from 4.0 °C in January to 29.1 °C in July, on average) with an annual mean rainfall of 1320 mm (China Meteorological Administration). The population in Nice (Southeastern France) is estimated at 345,000 inhabitants (INSEE, 2019) over 72 km2 with an annual mean air temperature of 14.8 °C (8.0 °C in January −22.3 °C in July) and an annual mean rainfall of 811 mm. Rome, capital city of Italy, has a total area of 1285 km2. The population in Rome is estimated at 2.9 million inhabitants (ISTAT, 2019). The Italian capital is characterized by a Mediterranean climate with an annual mean air temperature of 15.7 °C (from 7.7 °C in January to 24.4 °C in August) and the annual mean rainfall is 798 mm. The city of Turin, with 876,000 inhabitants over 130 km2, is located in North-western Italy and experiences a warm temperate climate. The annual mean air temperature is 12.0 °C (from 2.0 °C in January to 22.4 °C in July) with an annual mean rainfall of 980 mm. Valencia is the third largest city in Spain, with around 800,000 inhabitants over 135 km2. Valencia has a Mediterranean climate with short, very mild winters and long, hot and dry summers: with daily mean from 11.9 °C in January to 26.1 °C in August, and the annual mean rainfall is 475 mm (AEMET, 2020).
Nice, Rome, Turin and Valencia are located in the European region that is the most affected by air pollution, in particular by PM10 (Stafoggia et al., 2013) and O3 (Sicard et al., 2013), due to high temperature, strong insolation, anticyclonic subsidence combined with high road traffic and industrial emissions (Millán et al., 2000). The highest hourly O3 maxima (exceeding 120 ppb) are found in Southeastern France (Nice) and North-western Italy (Turin), in particular during summer (Sicard et al., 2013). In Italy, the highest PM10 concentrations are observed in Turin, where the air quality is among the worst in Europe, exceeding the limit values for PM10 and O3 e.g. 86 and 61 days, respectively in 2019 (Forni et al., 2019). Wuhan is a major transport hub with dozens of railways, roads, and expressways passing through the city and connecting to major cities in China (Wang et al., 2017). In Wuhan, the NO2 concentrations are increasing (+ 0.67 μg.m−3 per year) over the time period 2001–2014, while the PM10 concentrations showed a significant downward trend (− 2.0 μg.m−3 per year) since 2008 (Song et al., 2016). Nevertheless, the current annual PM10 (100–120 μg.m−3) and NO2 (50–60 μg.m−3) mean concentrations are still quite high, exceeding the air quality standards (Qian et al., 2007; Song et al., 2016).
2.2. Data selection and methodology
The hourly NO, NO2, PM2.5, PM10 and O3 concentrations were provided by the local and regional agencies in charge of air monitoring stations, i.e. the Certified Associations of Air Quality Monitoring in France (Atmo Sud), Regional Environmental Protection Agency in Italy (ARPA), Regional Ministry of the Environment of the Generalitat Valenciana in Spain, China's National Environmental Monitoring Center, and obtained from 1st January 2017 to 18th April 2020. A total of 36 monitoring stations with >75% of validated hourly data in a year were selected to calculate a valid aggregated value (24-h average concentration) and subsequent calculations. In Nice, data from 3 stations were used (3 with NO2, NO, PM10 and PM2.5, 2 with O3). In Rome, 15 stations were analyzed (15 with NO2 and NO, 9 with O3, 13 with PM10, and 6 with PM2.5). In Turin, 4 stations were selected (4 with NO2 and NO, 3 with O3 and PM10, and 2 with PM2.5). For Valencia, 6 stations were considered (6 with NO2, NO and O3, 4 with PM10 and PM2.5), while 8 stations were used for Wuhan (with all pollutants except NO). Among the stations, 1 station in Nice, 5 in Rome, and 3 in Valencia were identified as being closer to roads with a higher traffic load than in the other stations. Besides the analysis per city of all stations, this subset of stations was also analyzed separately and referred to as “traffic”.
To detect and estimate the changes within the time series, and quantify the lockdown effect on air pollutants levels, the deviations of 24-h mean concentrations (expressed in %) were computed for each day of the year (DOY) and station, by calculating the mean bias between the period before the lockdown (from 1st January 2020 until the start date of the lockdown) and during the lockdown in 2020 (from start date of the lockdown until 8th April in Wuhan i.e. the end date of the lockdown, and until 18th April in Nice, Turin, Rome and Valencia where the lockdown was still running at the time of data collection) and the same time period averaged over the 3 previous years (2017–2019), representing the baseline conditions. For each city, the mean NO, NO2, PM2.5, PM10 and O3 concentrations during the lockdown period in 2020 were calculated and compared with the mean concentrations during weekdays and weekends of the equivalent time period averaged over the 3 previous years (2017–2019). The objective was to estimate how different was a long and substantial reduction in activity in comparison with the reduced activity typical of the weekends. The non-parametric Kruskal-Wallis test followed by a post-hoc test using the criterion Fisher's Least Significant Difference and p adjusted with the Holm correction was used to test for statistical significances between groups. A p-value <0.05 was considered statistically significant.
3. Results
By averaging all stations, the seasonality of daily O3, NO2, NO, PM2.5, PM10 mean concentrations differed among cities from 1st January to 31st December averaged over the time period 2017–2019 (Figs. S1–S5). The highest O3 mean concentrations, reaching 90 μg.m−3 in summer, were observed in Turin and Wuhan following a bell-shaped function, while lower mean concentrations were recorded in Nice, Rome and Valencia (Fig. S1). The seasonal variations observed for NO and NO2 consisted of a winter peak and summer minima (Figs. S2, S3) with a marked seasonality and higher concentrations in both highly industrialized cities (Turin and Wuhan) and lower levels in Nice and Valencia. This enhanced seasonality of NOx levels in winter may be partly attributed to increased fossil fuels for domestic heating and driving. The PM levels were higher in Wuhan (PM10 up to 100 μg.m−3 in winter) than in the European cities, although values were also high in Turin, up to 50 μg.m−3 in winter (Figs. S4, S5). No remarkable seasonality of PM levels was observed in Nice, Rome and Valencia.
From 1st January to 18th April 2020, the highest O3 mean concentrations were observed in Wuhan (54.1 μg.m−3), followed by Nice (50.4 μg.m−3), while the lowest mean concentrations (37.3 μg.m−3) were recorded in Turin (Fig. 2 ). The highest NO2 concentrations were recorded in Turin (40.8 μg.m−3) and the lowest in Valencia (21.5 μg.m−3). The NO ranged from 10.6 μg.m−3 in Nice to 25.6 μg.m−3 in Turin (Fig. S6), while the NO data were not available from Wuhan. The average values of PM2.5 (Fig. 2) and PM10 (Fig. S7) were 43.1 μg.m−3 and 56.1 μg.m−3 in Wuhan, respectively, and 31.1 μg.m−3 and 42.9 μg.m−3 in Turin, respectively. The lowest mean values were recorded in Valencia, with concentrations of 11.3 μg.m−3 and 21.1 μg.m−3 of PM2.5 and PM10, respectively. When traffic stations were analyzed separately, they showed higher NO2 and NO concentrations and somewhat lower O3 concentrations. For example, in Valencia, NO2 was 59% higher in traffic stations, NO 28% and O3 5% (data not shown).
Fig. 2.

Daily ozone (O3), nitrogen dioxide (NO2) and particulate matter with an aerodynamic diameter lower than 2.5 µm (PM2.5) mean concentrations (μg.m−3) by joining all stations in Nice, Rome, Turin, Valencia and Wuhan from 1st January (Day of the Year, DOY = 1) to DOY = 150, averaged over the 3 previous years (2017–2019), and from DOY = 1 to the end date of the analyzed period in Europe (DOY = 109) and the lockdown in Wuhan (DOY = 98) in 2020. Vertical line: start date of the lockdown in 2020. Smoothing line: locally weighted smoother (LOESS).
In 2020, the daily O3 mean concentrations from 1st January 2020 until the start date of the lockdown were similar to the same period averaged over 2017–2019 (Table S1a) in Nice (+ 2.0%), Rome (−9.0%) and Wuhan (+4.2%), while the O3 concentrations were much lower in Valencia (−18.7%) due to cloudy and rainy conditions (AEMET, 2020), and much higher in Turin (+53.3%) due to high air temperature (5–10 °C above the 1971–2000 baseline) and no rainfall in February (ARPA, 2020). In Valencia, the O3 levels at traffic stations before the lockdown were lower (−13.1%) than the baseline conditions (Table S1b). Compared to 2017–2019, the daily O3 mean concentrations clearly increased at all stations during the lockdown (Fig. 3 ): +24.0% in Nice, +13.6% in Rome, +27.0% in Turin, +2.4% in Valencia and +36.4% in Wuhan. In a context of cloudy and rainy conditions before and during the lockdown in Valencia (AEMET, 2020), the response to lockdown measures was amplified at traffic stations (+ 11.4%).
Fig. 3.

Mean bias (±standard error, in %) at city-scale of 24-hour mean concentrations (PM2.5, PM10, NO, NO2 and O3) at all stations and traffic stations in Nice, Rome, Turin, Valencia and Wuhan between the lockdown period in 2020 and the same time period averaged over the 3 previous years (2017–2019).
The mean bias of daily NO2 concentrations before the lockdown at all stations were: - 14.2% in Nice, +1.6% in Rome, +2.6% in Turin, −20.0% in Valencia and −21.6% in Wuhan (Table S1a). During the lockdown, the changes in daily O3 mean concentrations at all stations were associated with a strong decline in NO2 mean concentrations compared to baseline conditions (Fig. 3): −62.8%, −45.6%, −30.4%, −69.0% and −57.2% in Nice, Rome, Turin, Valencia and Wuhan, while NO declined by 70.7%, 68.5%, 52.6% and by 61.9% in Nice, Rome, Turin and Valencia, respectively. For both NO and NO2, stronger reductions were observed during lockdown at traffic stations: −88.1% and −68.9% in Nice, −70.5% and −55.1% in Rome, −75.5% and −70.6% in Valencia, respectively (Table S1b).
At all stations, compared to baseline conditions 2017–2019, PM10 concentrations decreased during the lockdown (Fig. 3) by 5.9% in Nice (−7.8% before lockdown), 8.9% in Turin (+9.9%), 32.1% in Valencia (+14.5%) and 48.7% in Wuhan (−31.7%) while PM10 slightly increased by 1.8% in Rome (+18.5% before lockdown). Looking at PM2.5 we found: −2.9% (−19.0%), +10.6% (+22.6%), −12.6% (+8.1%), −12.6% (+24.3%) and −36.3% (−34.2%) in Nice, Rome, Turin, Valencia and Wuhan, respectively (Table S1a). The lockdown measures had a greater effect at traffic stations: PM10 and PM2.5 levels decreased by 7.6% and 8.0% in Nice, by −3.0% and −1.5% in Rome, and by 51.3% and 29.3% in Valencia (Table S1b).
By comparing mean concentrations during the 2020 lockdown with mean concentrations during weekdays and weekends of the equivalent time period over 2017–2019, we showed that higher O3 concentrations occurred during the lockdown, except in Valencia by combining all stations (Fig. 4 ). At all stations, the relative effect of lockdown relative to weekdays was 29.1% in Nice, i.e. the O3 mean concentration during the lockdown was 29.1% higher than on weekdays, 14.6% in Rome, 26.5% in Turin, 4.4% in Valencia and 35.1% in Wuhan (Table S2a). During the lockdown, the O3 levels were 9.8% higher than during the weekends in Nice, 7.1% in Rome, 24.8% in Turin, 37.7% in Wuhan, and 4.2% lower in Valencia. However, at traffic stations in Valencia, the O3 levels during the lockdown were 14.1% higher than on weekdays and 3.8% higher than on weekends (Table S2b). In all cities, the lowest mean NO2 concentrations were observed during the lockdown (Fig. 4). At all stations, the lockdown NO2 levels were 65.7% lower than on weekdays in Nice, 50.3% in Rome, 32.5% in Turin, 71.6% in Valencia and 56.8% in Wuhan. During the lockdown, the NO2 concentrations were 54.7% lower than on weekends in Nice, 42.2% in Rome, 20.6% in Turin, 62.9% in Valencia and 57.0% in Wuhan (Table S2a). At traffic stations, the NO2 levels during the lockdown were 70.9% lower than on weekdays in Nice, 57.5% in Rome and 72.8% in Valencia and 61.9% lower than on weekends in Nice, 51.3% in Rome and 64.6% in Valencia. Similar observations were found for NO (Table S2). The highest levels of PM10 were observed during the weekdays in Nice, Rome, Turin, and Valencia and during the weekends in Wuhan (Fig. 4). For PM10, the differences in daily concentrations between weekends and lockdown were <1 μg.m−3 in Nice, Rome and Turin (Table S2a). At all stations, the lockdown-weekday PM10 difference was - 7.3% in Nice, −0.4% in Rome, −13.0% in Turin, −41.1% in Valencia and −47.5% in Wuhan. The lockdown-weekend PM10 difference was of - 3.6% in Nice, +3.7% in Rome, −0.4% in Turin, −35.6% in Valencia and −49.5% in Wuhan. At traffic stations, the PM10 levels during the lockdown were 7.2% lower than on weekdays in Nice, 4.3% in Rome and 53.3% in Valencia, and 6.9% lower than on weekends in Nice, 0.7% in Rome and 49.5% in Valencia (Table S2b). Similar observations were found for PM2.5 (Table S2). Despite the overall consistency in the observed changes in all cities for the different air pollutants, at city level, some differences were statistically significant and others not due to the variability between stations, with the differences being more pronounced at traffic stations (Fig. 4).
Fig. 4.

Mean concentrations (±standard error, in μg.m−3) by joining all stations at city-scale of 24-hour mean concentrations (PM2.5, PM10, NO, NO2 and O3) in Nice, Rome, Turin, Valencia and Wuhan between the lockdown period in 2020 and the weekday and weekend of the equivalent time period averaged over the 3 previous years (2017–2019). Different letters represent significant differences between groups per city (Kruskal-Wallis test, p-value <0.05 significant).
4. Discussion
Urban air pollution levels are mainly influenced by local emissions and chemical mechanisms (Kent et al., 2007; Huszar et al., 2015; Monks et al., 2015). For instance, the local photochemical formation accounted for 75% of the daytime O3 in Wuhan in summer 2016 (Zeng et al., 2018). In this study, we considered that 3-year baseline conditions were long enough to reduce inter-annual variability in air pollution levels, here more influenced by local short-term emissions reduction rather than meteorological variations. By investigating the lockdown effects on air quality in cities, we have a better understanding of contributions from sectoral emissions to air pollution, in particular the O3 production, in order to formulate effective emission control policies. Among the dominant sectors contributing to air pollution in urban areas, the sectors “transport”, “industrial processes” and “commercial, institutional and households” were strongly impacted by the lockdown measures in China, France, Italy and Spain.
In Europe, the “transport” sector is the largest contributor to NOx emissions (road transport: 39%, non-road transport: 8%) and represents 13% of PM2.5 and PM10 emissions (EEA, 2019). The fuel and biomass combustion in the “commercial, institutional and households” (domestic heating) sector is the largest contributor to PM2.5 and PM10 emissions (56% and 39%, respectively) and represents 14% of NOx emissions, while 46% of non-methane VOCs and 8% of NOx are emitted by “industrial processes” sector. In Wuhan, the main source of air pollution recently shifted from coal combustion to a mixture of coal combustion and road traffic emissions (Wang et al., 2017) where the combustion of fossil fuel and road traffic are the largest contributors to PM2.5 and NO2 emissions, respectively (Wang et al., 2017).
The lockdown measures led to a decrease of NO (~63%) and NO2 (~53%) concentrations in Nice, Rome, Valencia and Wuhan, while NO and NO2 declined by 53% and 30% in the highly industrialized city of Turin. The lower reduction in Turin can be explained by a higher contribution of the “industrial” sector, where essential industrial activities (e.g. food, pharmaceutical) continued during the lockdown. Stronger reductions were observed at traffic stations for NO (~78%) and NO2 (~65%), where the “road transport” sector is the largest contributor to NOx emissions. The magnitude of changes in NO2 levels was similar between European cities (~52%) and Wuhan in China (57%), where automobile exhausts are the major source of NOx (Wang et al., 2017). As road and non-road transport were drastically reduced, the lockdown effect on NOx reduction was much higher than the weekend effect, with NOx concentrations during the lockdown on average 49% lower than on weekends at all stations, and 60% lower at traffic stations.
In Southern Europe, the lockdown measures did not significantly impact the PM2.5 and PM10 levels at all stations. Indeed, PM2.5 and PM10 concentrations decreased in Nice (3% and 6%) and Turin (13% and 9%) and increased in Rome (11% and 2%). Stronger reductions were observed in Valencia (13% and 32%). At traffic stations, the lockdown measures strongly decreased both PM2.5 and PM10 levels in Nice (8%), Rome (1–3%) and Valencia (29–51%). The observed decreases were due to the reduction of road and non-road transport, representing up to 15% of wintertime PM levels (Karamchandani et al., 2017), and the reduction of fuel combustion in closed institutional and commercial buildings. However, this decrease was counter-balanced by a PM increase from domestic heating (“requiring people to stay at home”) and garden activities (e.g. biomass burning). In Nice, and surrounding cities, the local authorities issued a regulation to drastically reduce the green waste burning. By comparing both the lockdown and weekend effects on PM levels at all stations, we showed that the lockdown had the same effect as weekends in Nice, Rome and Turin (~6% of difference). Such slight difference suggests that road traffic was not a large contributor to PM emissions but derived more from residential and tertiary sector in these cities. The citizens behave similarly during lockdown and weekends. The strong reductions in particles at traffic stations observed in Valencia during the lockdown resulted from a combination of factors: i) a higher baseline due to landscaping works in one of the traffic stations in previous years and ii) several rainy days (wash-out effect) during the lockdown period. A higher contribution of “transport” (road transport: 18%; non-road transport: 21%) to PM emissions, as reported in Barcelona (Karamchandani et al., 2017), could also partly explain the largest reduction observed in Valencia. In Wuhan, the PM2.5 and PM10 decreases by 36% and 49% were higher than those observed in Southern Europe (~4% and ~ 11%, respectively). In Wuhan, the emissions from household heating and cooking activities (ab. 32%), coal consumption and heavy industries harboring iron and steel smelts (accounted for 34% of secondary PM and 57% of primary dust) were the largest contributors to PM2.5 and PM10 emissions compared with ab. 5% from the “transport” sector (Qian et al., 2007; Wang et al., 2017). The lockdown had a higher effect than the weekends on PM reduction in Wuhan (~44% less), thus, the strong reduction can be attributed to the reduction of coal combustion in the tertiary sector and cessation of industrial activities.
During the lockdown 2020, the surface O3 levels increased by 24–27% in Nice and Turin, by 14% in Rome and by 36% in Wuhan. The slight increase of O3 levels in Valencia (2.4%) was mainly due to rainy and cloudy conditions (AEMET, 2020). In a recent paper, Tobías et al. (2020) reported an increase in O3 of 29% at urban stations of Barcelona between February 16th to March 13th and March 14th to 30th, 2020. At city-scale, the O3 formation depends on the VOC-NOx ratio (Pusede and Cohen, 2012). The urban areas are characterized by a low ratio due to high NOx concentrations (Beekmann and Vautard, 2010). The local O3 formation is generally limited by VOCs in Wuhan (Zeng et al., 2018) and in Southern Europe (Anav et al., 2019; Sicard et al., 2020). In this case, i.e. with “VOC-limited” conditions, a reduction in VOCs emission reduces the O3 formation, but a reduction in NOx emission increases the O3 formation. To effectively control O3 pollution in Wuhan, the reduction ratio of VOCs to NOx concentrations should not be lower than 0.73 (Zeng et al., 2018). The implementation of stringent lockdown measures produced more reduced NOx emissions than VOCs emissions in the investigated cities, leading to higher VOC-NOx ratio, which enhanced the O3 production. During the lockdown, an increase in O3 precursors emissions such as carbon monoxide (CO) and VOCs from home (e.g. cleaning, fireplaces) and garden activities (e.g. barbeques, biomass burning) may also have contributed to the O3 increase (Coe et al., 2003; Su et al., 2003; Murphy et al., 2007; Wolff et al., 2013).
In cities, the freshly emitted NO, in particular from road traffic, depletes O3 locally (Solberg et al., 2005; Molina et al., 2009). The O3 titration occurs particularly in winter (less photolysis reactions of NO2) under high NOx levels (Sillman, 1999). Following the lockdown measures, the clear upward trend observed at all stations, resulted primarily from a lower titration of O3 by NO due to the reduction in local NOx emissions by road transport (e.g. Huszar et al., 2015; Sicard et al., 2016a). In different European cities, the relative contribution of road traffic emissions to O3 levels was 12–35% and 20–24% in three Mediterranean cities: Lisbon, Barcelona and Athens (Valverde et al., 2016; Karamchandani et al., 2017; Mertens et al., 2019). In Wuhan, the vehicle exhausts made the largest contribution to O3 production, with 30% during non-high O3 days (Zeng et al., 2018). These findings are in agreement with the rate of O3 increase observed due to the lockdown measures.
Furthermore, a reduction in PM2.5 and PM10 could also lead to an increase in surface O3 concentrations (Liu et al., 2013; Li et al., 2017). As PM emissions were lower during the lockdown, the higher solar radiation favored O3 formation (Heuss et al., 2003; Murphy et al., 2007; Wolff et al., 2013). In addition to photochemical reactions, the heterogeneous chemical processes occurring on the surface of PM2.5 and aerosols in the atmosphere are also an important way for the interaction between O3 and PM2.5 (Meng et al., 1997; Jacob, 2000; Deng et al., 2010; Li et al., 2011). In Nanjing, high concentrations of PM2.5 (rising from 100 to 250 μg.m−3) resulted in a reduction of 130 W.m−2 of the irradiance and a 12% reduction of near-surface O3 (Li et al., 2017).
In urban stations in France, Italy and Spain, the mean O3 concentration on the weekend was 12% higher than on weekdays over the time period 2005–2014 (Sicard et al., 2020). The O3 weekend effect is more pronounced in winter (Sicard et al., 2020). In this study, we showed that the mean O3 concentrations during the lockdown were on average 10% and 38% higher than on weekend in Southern Europe and Wuhan, respectively. Generally, the lockdown effect on O3 production was higher than O3 weekend effect, mainly due to the longer period of NOx reduction. Furthermore, the average lifetime of O3 in the troposphere is estimated at 20–24 days (Stevenson et al., 2006).
5. Conclusions
Following the implementation of stringent lockdown measures in the framework of the COVID-19 pandemic, the reduction in road and non-road transport, non-essential businesses and industrial activities led to significant declines in NOx and PM concentrations, especially in Wuhan. The lockdown measures led to a reduction of NOx concentrations of ~56% due to the large reduction of the “transport” sector (e.g. 70% in France). During the lockdown, the PM levels slightly changed (<10% of change). Indeed, the restrictive measures reduced emissions of PM2.5 and PM10 by road and non-road transport and by fuel combustion in institutional and commercial buildings, but these decreases were counter-balanced by an increase of PM emissions from the activities at home (e.g. domestic heating, biomass burning). Due to stringent lockdown measures, generally the near-surface O3 increased by ~17% in Southern European cities and by 36% in Wuhan, i.e. similarly to the relative contribution of road traffic emissions to O3 levels. The O3 increase is due to a lower titration of O3 by NO due to the strong reduction in local NOx emissions by road transport. Overall, the largest effect of the lockdown measures on concentrations of NOx, PM and O3 came from the large reduction in road transport, as observed at traffic stations. The NOx reduction during the lockdown was higher than the VOCs reduction. Similarly to the O3 weekend effect, the main causes of the higher O3 concentrations in cities during the lockdown, under VOC-limited conditions, are: i) a reduction in NOx emissions from road traffic leading to a lower O3 titration by NO (dominant cause); ii) as PM emissions were lower, the higher solar radiation favored O3 formation; and iii) an increase of O3 precursors emissions from home and garden activities.
In Southern Europe and Wuhan, NOx concentrations during the lockdown were on average 49% lower than on weekends. The lockdown effect on O3 production was 10% higher than the O3 weekend effect in Southern Europe and 38% higher in Wuhan. The lockdown did not lead to lower PM pollution than a « routine » weekend effect in Southern Europe (~6% of change). The unprecedented reduction in mobility and economic activity caused by the COVID-19 lockdown represents an exceptional opportunity for studying the contribution of different sources of primary pollutant and for understanding the changes in the atmospheric chemistry under conditions of reduced primary pollutant emissions in the cities. For secondary pollutants like O3, the lockdown has also shown that its reduction will remain challenging even with effective policies for reducing primary pollutants.
CRediT authorship contribution statement
Pierre Sicard: Conceptualization, Investigation, Writing - original draft. Alessandra De Marco: Investigation, Writing - review & editing. Evgenios Agathokleous: Writing - review & editing. Zhaozhong Feng: Investigation, Writing - review & editing. Xiaobin Xu: Investigation, Writing - review & editing. Elena Paoletti: Writing - review & editing. José Jaime Diéguez Rodriguez: Investigation, Writing - review & editing. Vicent Calatayud: Conceptualization, Investigation, Data curation, Writing - original draft.
Declaration of competing interest
The authors declare that they have no known competing financial interests or personal relationships that could have appeared to influence the work reported in this paper.
Acknowledgements
In the framework of the Research Group 8.04.00 “Air Pollution and Climate Change” and the Working Party 8.04.05 “Ground-level ozone” of the International Union of Forest Research Organizations (IUFRO), this work was made possible with the access to the air quality database of the Certified Associations of Air Quality Monitoring in France (Atmo Sud), Regional Environmental Protection Agency in Italy (ARPA), Regional Ministry of the Environment of the Generalitat Valenciana in Spain, China's National Environmental Monitoring Center. E.P. acknowledges Sofia Martini (CNR) and Roberta De Maria (ARPA) for data provision, and the INTERREG ALCOTRA project MITIMPACT for support. E.A. and Z.F. acknowledge multi-year support from The Start-up Foundation for Introducing Talent of Nanjing University of Information Science & Technology (NUIST), Nanjing, China (No. 003080 to E.A. and No. 002992 to Z.F.). V.C. thanks Project IMAGINA (PROMETEU 2019, Generalitat Valenciana).
Footnotes
Supplementary data to this article can be found online at https://doi.org/10.1016/j.scitotenv.2020.139542.
Appendix A. Supplementary data
Supplementary material
References
- Adame J.A., Hernández-Ceballos M.Á., Sorribas M., Lozano A., De la Morena B.A. Weekend-weekday effect assessment for O3, NOx, CO and PM10 in Andalusia, Spain (2003–2008) Aerosol Air Qual. Res. 2014;14:1862–1874. [Google Scholar]
- AEMET Spanish state meteorological agency. 2020. http://www.aemet.es/en/portada
- Analitis A., Dé Donato F., Scortichini M., Lanki T., Basagana X., Ballester F. Synergistic effects of ambient temperature and air pollution on health in Europe: results from the PHASE project. Int. J. Environ. Res. Public Health. 2018;15:E1856. doi: 10.3390/ijerph15091856. [DOI] [PMC free article] [PubMed] [Google Scholar]
- Anav A., De Marco A., Friedlingstein P., Khvorostyanov D., Menut L., Liu Q. Growing season extension affects ozone uptake by European forests. Sci. Total Environ. 2019;669:1043–1052. doi: 10.1016/j.scitotenv.2019.03.020. [DOI] [PubMed] [Google Scholar]
- ARPA Agenzia Regionale per la Protezione Ambientale del Piemonte. 2020. www.arpa.piemonte.it
- Beekmann M., Vautard R. A modelling study of photochemical regimes over Europe: robustness and variability. Atmos. Chem. Phys. 2010;10:10067–10084. [Google Scholar]
- Blanchard C.L., Tanenbaum S., Lawson D.R. Differences between weekday and weekend air pollutant levels in Atlanta; Baltimore; Chicago; Dallas-Fort Worth; Denver; Houston; New York; Phoenix; Washington, DC; and surrounding areas. J. Air Waste Manage. Assoc. 2008;58:1598–1615. doi: 10.3155/1047-3289.58.12.1598. [DOI] [PubMed] [Google Scholar]
- Coe D.L., Gorin C.A., Chinkin L.R., Reid S.B. 2003. Weekday-weekend Activity Patterns for Area Sources in the Los Angeles Area. Presented at the U.S. EPA 12th Annual Emission Inventory Conference, “Emission Inventories: Applying New Technologies”. 28th April–1st May 2003. San Diego, California. [Google Scholar]
- Cohen A.J., Brauer M., Burnett R., Anderson H.R., Frostad J., Estep K. Estimates and 25-year trends of the global burden of disease attributable to ambient air pollution: an analysis of data from the Global Burden of Diseases Study 2015. Lancet. 2017;389:1907–1918. doi: 10.1016/S0140-6736(17)30505-6. [DOI] [PMC free article] [PubMed] [Google Scholar]
- CLRTAP . UNECE Convention on Long-range Transboundary Air Pollution. 2017. Mapping Critical Levels for Vegetation, Chapter III of Manual on methodologies and criteria for modelling and mapping critical loads and levels and air pollution effects, risks and trends. Accessed on 1st May 2020 on web at www.icpmapping.org.lrtap. [Google Scholar]
- De Marco A., Sicard P., Khaniabadi Y.O., Hopke P.K., Amoatey P. Mortality and morbidity for cardiopulmonary diseases related to PM2.5 exposure in the metropolis of Rome, Italy. Eur. J. Intern. Med. 2018;57:49–57. doi: 10.1016/j.ejim.2018.07.027. [DOI] [PubMed] [Google Scholar]
- Deng J.J., Wang T.J., Liu L., Jiang F. Modeling heterogeneous chemical processes on aerosol surface. Particuology. 2010;8:308–318. [Google Scholar]
- Diéguez J.J., Calatayud V., Mantilla E. 2014. CEAM Report for the Ministry of Agriculture, Food and Environment, Fundación Biodiversidad, Informe Final, Memoria Técnica Proyecto CONOZE, CONtaminación por OZono en España. (137 pp) [Google Scholar]
- Directive 2016/2284 of the European Parliament and of the Council of 14 December 2016 on the reduction of national emissions of certain atmospheric pollutants, amending Directive 2003/35/EC and repealing Directive 2001/81/EC. In: EC Official Journal of the European Union L. 344 of 17.12.2016.
- EEA, European Environment Agency . 2018. Air Quality in Europe - 2018. EEA Report no 12/2018. (88 pp) [Google Scholar]
- EEA, European Environment Agency . 2019. European Union Emission Inventory Report 1990–2017 Under the UNECE Convention on Long-range Transboundary Air Pollution (LRTAP) (EEA Report no 08/2019). (Copenhagen, ISSN 1977-8449, 148pp) [Google Scholar]
- European Union Directive 2008/50/EC of the European Parliament and of the council of 21 May 2008 on ambient air quality and cleaner air for Europe. Official Journal L. 2008;152:1–44. 11.6.2008. [Google Scholar]
- Feng Z., De Marco A., Anav A., Gualtieri M., Sicard P., Tian H. Economic losses due to ozone impacts on human health, forest productivity and crop yield across China. Environ. Int. 2019;131 doi: 10.1016/j.envint.2019.104966. [DOI] [PubMed] [Google Scholar]
- Forni E., Negro E., Carlucci C., Nasso A., Struppek M. Actions against air pollution in Turin for a healthy and playable city. Cities & Health. 2019;3:53–58. [Google Scholar]
- Guerreiro C.B.B., Foltescu V., de Leeuw F. Air quality status and trends in Europe. Atmos. Environ. 2014;98:376–384. [Google Scholar]
- Heuss J.M., Kahlbaum D.F., Wolff G.T. Weekday/weekend ozone differences: what can we learn from them? J. Air Waste Manage. Assoc. 2003;53:772–788. doi: 10.1080/10473289.2003.10466227. [DOI] [PubMed] [Google Scholar]
- Huszar P., Belda M., Halenka T. On the long term impact of emissions from central European cities on regional air-quality. Atmos. Chem. Phys. Discuss. 2015;15:32101–32155. [Google Scholar]
- Institut National de la Statistique et des Etudes Economiques, INSEE 2019. https://www.insee.fr (accessed on 26 April 2019)
- Istituto Nazionale di Statistica, ISTAT 2019. https://www.istat.it (accessed on 26 April 2019)
- Jacob D.J. Heterogeneous chemistry and tropospheric ozone. Atmos. Environ. 2000;34:2131–2159. [Google Scholar]
- Jiménez P., Parra R., Gassó S., Baldasano J.M. Modeling the ozone weekend effect in very complex terrains: a case study in the northeastern Iberian Peninsula. Atmos. Environ. 2005;39:429–444. [Google Scholar]
- Karamchandani P., Long Y., Pirovano G., Balzarini A., Yarwood G. Source-sector contributions to European ozone and fine PM in 2010 using AQMEII modeling data. Atmos. Chem. Phys. 2017;17:5643–5664. [Google Scholar]
- Karl T., Graus M., Striednig M., Lamprecht C., Hammerle A., Wohlfahrt G. Urban eddy covariance measurements reveal significant missing NOx emissions in Central Europe. Sci. Rep. 2017;7:2536. doi: 10.1038/s41598-017-02699-9. [DOI] [PMC free article] [PubMed] [Google Scholar]
- Kent A.J., Grice S., Stedman J.R., Bush T.J., Vincent K.J., Abbott J. 2007. UK Air Quality Modelling for Annual Reporting 2005 on Ambient Air Quality Assessment Under Council Directives 96/62/EC, 1999/30/EC and 2000/69/EC. AEA Energy & Environment. Report AEAT/ENV/R/2278. [Google Scholar]
- Lefohn A.S., Malley C.S., Smith L., Wells B., Hazucha M., Simon H. Tropospheric ozone assessment report: global ozone metrics for climate change, human health, and crop/ecosystem research. Elem. Sci. Anth. 2018;6:28. doi: 10.1525/elementa.279. [DOI] [PMC free article] [PubMed] [Google Scholar]
- Lelieveld J., Evans J.S., Fnais M., Giannadaki D., Pozzer A. The contribution of outdoor air pollution sources to premature mortality on a global scale. Nature. 2015;525:367–371. doi: 10.1038/nature15371. [DOI] [PubMed] [Google Scholar]
- Li J., Wang Z., Wang X., Yamaji K., Takigawa M., Kanaya Y. Impacts of aerosols on summertime tropospheric photolysis frequencies and photochemistry over central eastern China. Atmos. Environ. 2011;45:1817–1829. [Google Scholar]
- Li M., Wang T., Xie M., Li S., Zhuang B., Chen P. Impacts of aerosol-radiation feedback on local air quality during a severe haze episode in Nanjing megacity, eastern China. Tellus B. 2017;69:1339548. [Google Scholar]
- Liu H., Wang X.M., Pang J.M., He K.B. Feasibility and difficulties of China’s new air quality standard compliance: PRD case of PM2.5 and ozone from 2010 to 2025. Atmos. Chem. Phys. 2013;13:12013–12027. [Google Scholar]
- Liu H., Liu S., Xue B.R., Lv Z.F., Meng Z.H., Yang X.F. Ground-level ozone pollution and its health impacts in China. Atmos. Environ. 2018;173:223–230. [Google Scholar]
- Liu J., Han Y., Tang X., Zhu J., Zhu T. Estimating adult mortality attributable to PM2.5 exposure in China with assimilated PM2.5 concentrations based on a ground monitoring network. Sci. Total Environ. 2016;568:1253–1262. doi: 10.1016/j.scitotenv.2016.05.165. [DOI] [PubMed] [Google Scholar]
- Liu Y., Wang T. Worsening urban ozone pollution in China from 2013 to 2017 –part 1: the complex and varying roles of meteorology. Atmos. Chem. Phys. Discuss. 2020:1–28. doi: 10.5194/acp-2019-1120. [DOI] [Google Scholar]
- Meng Z., Dabdub D., Seinfeld J.H. Chemical coupling between atmospheric ozone and particulate matter. Science. 1997;277:116–119. [Google Scholar]
- MEP - Ministry of Environmental Protection . 2012. Government of China, Ambient Air Quality Standards (in Chinese). GB 3095–2012. [Google Scholar]
- Mertens M., Kerkweg A., Grewe V., Jöckel P., Sausen R. Attributing land transport emissions to ozone and ozone precursors in Europe and Germany. Atmos. Chem. Phys. Discuss. 2019 doi: 10.5194/acp-2019-715. [DOI] [Google Scholar]
- Millán M.M., Mantilla E., Salvador R., Carratalá A., Sanz M.J., Alonso L. Ozone cycles in the Western Mediterranean basin: interpretation of monitoring data in complex coastal terrain. J. Appl. Meteorol. 2000;39:487–508. [Google Scholar]
- Mills G., Hayes F., Simpson D., Emberson L., Norris D., Harmens H. Evidence of widespread effects of ozone on crops and (semi-)natural vegetation in Europe (1990–2006) in relation to AOT40 and flux-based risk maps. Glob. Chang. Biol. 2011;17:592–613. [Google Scholar]
- Molina L.T., de Foy B., Vázquez Martínez O., Páramo Figuero V.H. WMO Bulletin. 2009. Air quality, weather and climate in Mexico City; p. 58. (January 2009) [Google Scholar]
- Monks P.S., Archibald A.T., Colette A., Cooper O., Coyle M., Derwent R. Tropospheric ozone and its precursors from the urban to the global scale from air quality to short-lived climate forcer. Atmos. Chem. Phys. 2015;15:8889–8973. [Google Scholar]
- Murphy J.G., Day D.A., Cleary P.A., Wooldridge P.J., Millet D.B., Goldstein The weekend effect within and downwind of Sacramento – part 1: observations of ozone, nitrogen oxides, and VOC reactivity. Atmos. Chem. Phys. 2007;7:5327–5339. [Google Scholar]
- Nuvolone D., Petri D., Voller F. The effects of ozone on human health. Environ. Sci. Pollut. Res. 2018;25:8074–8088. doi: 10.1007/s11356-017-9239-3. [DOI] [PubMed] [Google Scholar]
- Paoletti E., De Marco A., Beddows D.C.S., Harrison R.M., Manning W.J. Ozone levels in European and USA cities are increasing more than at rural sites, while peak values are decreasing. Environ. Pollut. 2014;192:295–299. doi: 10.1016/j.envpol.2014.04.040. [DOI] [PubMed] [Google Scholar]
- Pascal M., Corso M., Chanel O., Declercq C., Badaloni C., Cesaroni G. Assessing the public health impacts of urban air pollution in 25 European cities: results of the Aphekom project. Sci. Total Environ. 2013;449:390–400. doi: 10.1016/j.scitotenv.2013.01.077. [DOI] [PubMed] [Google Scholar]
- Pusede S.E., Cohen R.C. On the observed response of ozone to NOx and VOC reactivity reductions in San Joaquin Valley California 1995-present. Atmos. Chem. Phys. 2012;12:8323–8339. [Google Scholar]
- Qian Z., He Q., Lin H.M., Kong L., Liao D., Dan J. Association of daily cause-specific mortality with ambient particle air pollution in Wuhan, China. Environ. Res. 2007;105:380–389. doi: 10.1016/j.envres.2007.05.007. [DOI] [PubMed] [Google Scholar]
- Qin Y., Tonnesen G.S., Wang Z. Weekend/weekday differences of ozone, NOx, CO, VOCs, PM10 and the light scatter during ozone season in southern California. Atmos. Environ. 2004;38:3069–3087. [Google Scholar]
- Ren M., Li N., Wang Z., Liu Y., Chen X., Chu Y. The short-term effects of air pollutants on respiratory disease mortality in Wuhan, China: comparison of time-series and case-crossover analyses. Sci. Rep. 2017;7:40482. doi: 10.1038/srep40482. [DOI] [PMC free article] [PubMed] [Google Scholar]
- Schipa I., Tanzarella A., Mangia C. Differences between weekend and weekday ozone levels over rural and urban sites in southern Italy. Environ. Monit. Assess. 2009;156:509–523. doi: 10.1007/s10661-008-0501-5. [DOI] [PubMed] [Google Scholar]
- Seinfeld J.H., Pandis S.N. Wiley; New York, USA: 1998. Atmospheric Chemistry and Physics. From Air Pollution to Climate Changes. (1998) [Google Scholar]
- Shen G.F., Yuan S.Y., Xie Y.N., Xia S.J., Li L., Yao Y.K. Ambient levels and temporal variations of PM2.5 and PM10 at a residential site in the mega-city, Nanjing, in the western Yangtze River Delta, China. J. Environ. Sci. Health A Tox. Hazard. Subst. Environ. Eng. 2014;49:171–178. doi: 10.1080/10934529.2013.838851. [DOI] [PubMed] [Google Scholar]
- Sicard P., De Marco A., Troussier F., Renou C., Vas N., Paoletti E. Decrease in surface ozone concentrations at Mediterranean remote sites and increase in the cities. Atmos. Environ. 2013;79:705–715. [Google Scholar]
- Sicard P., Serra R., Rossello P. Spatio-temporal trends of surface ozone concentrations and metrics in France. Environ. Res. 2016;149:122–144. doi: 10.1016/j.envres.2016.05.014. [DOI] [PubMed] [Google Scholar]
- Sicard P., Augustaitis A., Belyazid S., Calfapietra C., De Marco A., Fenn M. Global topics and novel approaches in the study of air pollution, climate change and forest ecosystems. Environ. Pollut. 2016;213:977–987. doi: 10.1016/j.envpol.2016.01.075. [DOI] [PubMed] [Google Scholar]
- Sicard P., Agathokleous E., Araminienė V., Carrari E., Hoshika Y., De Marco A. Should we see urban trees as effective solutions to reduce increasing ozone levels in cities? Environ. Pollut. 2018;243:163–176. doi: 10.1016/j.envpol.2018.08.049. [DOI] [PubMed] [Google Scholar]
- Sicard P., Khaniabadi Y.O., Perez S., Gualtieri M., De Marco A. Effect of O3, PM10 and PM2.5 on cardiovascular and respiratory diseases in cities of France, Iran and Italy. Environ. Sci. Pollut. Res. Int. 2019;26:32645–32665. doi: 10.1007/s11356-019-06445-8. [DOI] [PubMed] [Google Scholar]
- Sicard P., Paoletti E., Agathokleous E., Araminienė V., Proietti C., Coulibaly F. Ozone weekend effect in cities: deep insights for urban air pollution control. Environ. Res. 2020 doi: 10.1016/j.envres.2020.110193. (ER-S-20-02080 (submitted) [DOI] [PMC free article] [PubMed] [Google Scholar]
- Sillman S. The relation between ozone, NOx and hydrocarbons in urban and polluted rural environments. Atmos. Environ. 1999;33:1821–1845. [Google Scholar]
- Solberg S., Bergström R., Langner J., Laurila T., Lindskog A. Changes in Nordic surface ozone episodes due to European emission reductions in the 1990s. Atmos. Environ. 2005;39:179–192. [Google Scholar]
- Song J., Guang W., Li L., Xiang R. Assessment of air quality status in Wuhan, China. Atmosphere. 2016;7:56. [Google Scholar]
- Stafoggia M., Samoli E., Alessandrini E., Cadum E., Ostro B., Berti G. Short-term associations between fine and coarse particulate matter and hospitalizations in southern Europe: results from the MED-PARTICLES project. Environ. Health Perspect. 2013;121:1026–1033. doi: 10.1289/ehp.1206151. [DOI] [PMC free article] [PubMed] [Google Scholar]
- Stevenson D.S., Schultz M.G., Ellingsen K., van Noije T.P.C., Wild O., Zeng G. Multimodel ensemble simulations of present-day and near-future tropospheric ozone. J. Geophys. Res. 2006;111 [Google Scholar]
- Su F.C., Mukherjee B., Batterman S. Determinants of personal, indoor and outdoor VOC concentrations: an analysis of the RIOPA data. Environ. Res. 2003;126:192–203. doi: 10.1016/j.envres.2013.08.005. [DOI] [PMC free article] [PubMed] [Google Scholar]
- Tobías A., Carnerero C., Reche C., Massagué J., Via M., Minguillón M.C. Changes in air quality during the lockdown in Barcelona (Spain) one month into the SARS-CoV-2 epidemic. Sci. Total Environ. 2020;726 doi: 10.1016/j.scitotenv.2020.138540. [DOI] [PMC free article] [PubMed] [Google Scholar]
- United Nations . Department of Economic and Social Affairs, Population Division; 2019. World Urbanization Prospects 2018 - Highlights. (ST/ESA/SER.A/421) [Google Scholar]
- Valverde V., Pay M.T., Baldasano J.M. Ozone attributed to Madrid and Barcelona on-road transport emissions: characterization of plume dynamics over the Iberian Peninsula. Sci. Total Environ. 2016;543:670–682. doi: 10.1016/j.scitotenv.2015.11.070. [DOI] [PubMed] [Google Scholar]
- Wang S., Yu S., Yan R., Zhang Q., Li P., Wang L. Characteristics and origins of air pollutants in Wuhan, China, based on observations and hybrid receptor models. J. Air Waste Manage. Assoc. 2017;67:739–753. doi: 10.1080/10962247.2016.1240724. [DOI] [PubMed] [Google Scholar]
- Weinmayr G., Romeo E., De Sario M., Weiland S.K., Forastiere F. Short-term effects of PM10 and NO2 on respiratory health among children with asthma or asthma-like symptoms: a systematic review and meta-analysis. Environ. Health Perspect. 2010;118:449–457. doi: 10.1289/ehp.0900844. [DOI] [PMC free article] [PubMed] [Google Scholar]
- Wolff G.T., Kahlbaum D.F., Heuss J.M. The vanishing ozone weekday/weekend effect. J. Air Waste Manage. Assoc. 2013;63:292–299. doi: 10.1080/10962247.2012.749312. [DOI] [PubMed] [Google Scholar]
- World Health Organisation . World Health Organization, Regional Office for Europe; Copenhagen, Denmark: 2006. WHO Air Quality Guidelines for Particulate Matter, Ozone, Nitrogen Dioxide and Sulfur Dioxide - Global Update 2005 - Summary of Risk Assessment. (WHO/SDE/PHE/OEH/06.02) [Google Scholar]
- World Health Organisation . World Health Organization, Regional Office for Europe; Copenhagen, Denmark: 2013. Review of Evidence on Health Aspects of Air Pollution - REVIHAAP Project. Technical Report. [Google Scholar]
- World Health Organisation Global Health Observatory data. 2019. https://www.who.int/gho/phe/outdoor_air_pollution/burden/en/.t
- World Health Organisation 2020. https://www.who.int/csr/don/12-january-2020-novel-coronavirus-china/en/
- Xie M., Zhu K., Wang T., Chen P., Han Y., Li S. Temporal characterization and regional contribution to O3 and NOx at an urban and a suburban site in Nanjing, China. Sci. Total Environ. 2016;551-552:533–545. doi: 10.1016/j.scitotenv.2016.02.047. [DOI] [PubMed] [Google Scholar]
- Zeng P., Lyu X., Guo H., Hu Y.Q. Causes of ozone pollution in summer in Wuhan, Central China. Environ. Pollut. 2018;241:852–861. doi: 10.1016/j.envpol.2018.05.042. [DOI] [PubMed] [Google Scholar]
- Zou Y., Charlesworth E., Yin C.Q., Yan X.L., Deng X.J., Li F. The weekday/weekend ozone differences induced by the emissions change during summer and autumn in Guangzhou, China. Atmos. Environ. 2019;199:114–126. [Google Scholar]
Associated Data
This section collects any data citations, data availability statements, or supplementary materials included in this article.
Supplementary Materials
Supplementary material