

Abstract
Objectives
To estimate the basic reproduction number of the Wuhan novel coronavirus (2019‐nCoV).
Methods
Based on the susceptible‐exposed‐infected‐removed (SEIR) compartment model and the assumption that the infectious cases with symptoms occurred before 26 January, 2020 are resulted from free propagation without intervention, we estimate the basic reproduction number of 2019‐nCoV according to the reported confirmed cases and suspected cases, as well as the theoretical estimated number of infected cases by other research teams, together with some epidemiological determinants learned from the severe acute respiratory syndrome (SARS).
Results
The basic reproduction number fall between 2.8 and 3.3 by using the real‐time reports on the number of 2019‐nCoV‐infected cases from People's Daily in China and fall between 3.2 and 3.9 on the basis of the predicted number of infected cases from international colleagues.
Conclusions
The early transmission ability of 2019‐nCoV is close to or slightly higher than SARS. It is a controllable disease with moderate to high transmissibility. Timely and effective control measures are needed to prevent the further transmissions.
Keywords: 2019 novel coronavirus (2019‐nCoV), basic reproduction number, epidemiology
1. INTRODUCTION
The transmission of pneumonia associated with the Novel Coronavirus Pneumonia (NCP) originated in Wuhan city has not yet been effectively blocked. In the meanwhile, the number of confirmed and suspected cases is increasing rapidly. Estimating the epidemiological determinants of 2019‐nCoV is significant and urgent regarding the assessment of epidemic transmissibility, the prediction of future trend of epidemic spreading, as well as the design of control measures. The basic reproduction number is the most important parameter to determine the intrinsic transmissibility, defined as the average number of secondary infectious cases generated by an index case in a completely susceptible population without any interventions.1 During the outbreak of an epidemic, due to interventions and control measures from government, reaction of personal behaviors (sterilizing, wearing masks, washing hands, reducing contacts, etc.), the depletion of susceptible populations, and the seasonality of transmissibility, the basic reproduction number is generalized to the effective reproduction number, which is defined as the average number of secondary cases generated by an infectious case at time t, and is denoted by Rt. The epidemic is considered to be under control when Rt < 1.
We assumed that the infected individuals whose onset time of symptoms no later than January 25, 2020 were resulted from the free propagation, that is, the transmission was without interventions. Regarding the reports of real‐time data of 2019‐nCoV situation jointly by the People's Daily in China (https://3g.dxy.cn/newh5/view/pneumonia?scene=2&clicktime=1579583352&enterid=1579583352&from=timeline&isappinstalled=0) and DXY.cn (an online community for health care professionals; https://m.weibo.cn/u/2803301701), as well as the estimated number of 2019‐nCoV infections from the research group led by the Northeastern University 2 (these two data sources are later abbreviated as People's Daily Reports and Northeastern University Reports), we estimated the basic reproduction number of 2019‐nCoV based on the susceptible‐exposed‐infected‐removed (SEIR) compartment model.
2. METHODS
This article was intended to estimate the basic reproduction number under the situation of free propagation, which was the initial stage of the spread of 2019‐nCoV without the interventions. Most Chinese people were aware of the outbreak of 2019‐nCoV by the mainstream media after 20 January 2020. The Hubei government released the announcement about strengthening the prevention and control measures against 2019‐nCoV, and launched the second‐level public health emergency response at 2:40 am on January 22, 2020. Thus, the public awareness and effective interventions were absent when the time was prior to this point. As the median value of the incubation period of SARS was 6.4 days (95% CI 5.2 to 7.7 days) 3, and the 2019‐nCoV incubation period was 5.1 days according to a recent report on a few confirmed cases,4 we inferred that the confirmed cases before January 26, 2020 were infected during the free propagation of 2019‐nCoV. Meanwhile, the confirmed cases after January 25 were not suitable for the analyses since the cases were generated in the following days were not during the free propagation.
We used the SEIR compartment model 5 to characterize the early spreading of 2019‐nCoV, where each individual could be in one of the following four states: susceptible (S), exposed (E, being infected but without infectiousness), infected (I, with infectiousness), and removed (R). At each time step (in days in later analyses), a susceptible individual would turn to be an exposed individual with probability β if she/he contacts with an infected individual, an exposed individual had a probability γ1 to become infected, and an infected would be removed with probability γ2. The dynamical process of SEIR thus could be described as:
where S(t), E(t), I(t), and R(t), respectively, represent the number of individuals in the susceptible, exposed, infectious, and recovered states at time t, and N is the total number of individuals in the system such that N = S(t) + E(t) + I(t) + R(t). The infected population during early transmission was negligible compared with the total population, that is, when t approaches 0, S(t) approaches to N. The basic reproduction number could then be approximated as 6:
where is the growth rate of the early exponential growth and is the number of infected people with symptom by time t. The exposed period and the infection period could be expressed as and . Generation time could then be approximated as . Denote by the ratio of exposed period to generation time, the basic reproduction number could be rewritten as
3. RESULTS
To estimate R0, the parameters λ, ρ, and were needed, where λ was determined by . Below was the detailed discussion about these three parameters.
According to the real‐time dynamic data of 2019‐nCoV by the People's Daily Reports, there were 1408 confirmed cases and 2032 suspected cases by the time of 23:59 on January 25, 2020. In reality, there should be a certain fraction of infected people with symptoms having not been found.2, 7, 8 If we ignored this situation and suppose that there will be a fraction q of the suspected cases would be confirmed further (on the basis of an early report that 41 of the 59 suspected cases were eventually confirmed, the reference value of q was 41/59 = 0.695), then the number of cases with symptoms on 25 January was . Note that the real number of cases was probably much larger than 2820. We considered this number as the optimistic situation (the lower bound of the number of cases having onset of symptoms). If we took the Northeastern University Reports 2 as the reference, there would be about 4050 cases on January 20, 2020, and about 12 700 cases on January 24, 2020. This result was mainly based on the number of confirmed cases in overseas that were exported from Wuhan. Even though there might be a large bias due to the highly limited samples, it should be seriously considered as all other methods were also very preliminary and some reports 7, 8 showed similar results to the Northeastern University Reports.2 Read et al 8 inferred that the actual number of confirmed cases was only 5.1%, including the cases without symptoms. If only 5% of symptomatic infections were detected (more pessimistic than the results of Read's study 8), then according to the confirmed cases (1408) by January 25, the number of cases with symptoms was 28 160, 10 times larger than the optimistic one. We used it as the upper bound of Y(t) in sensitivity analysis. We set the date December 8, 2019, the presence time of the first pneumonia of unknown etiology, as t = 0. In fact, t might be slightly earlier than December 8, since the symptoms might have appeared for some time before to the hospital. Hence, the estimated basic reproduction number might be a bit higher by using December 8, 2019 as t = 0. Based on the above analysis, we mainly used Y(48) = 2820 from the People's Daily Reports, and Y(43) = 4050, Y(47) = 12 700 form the Northeastern University Reports.2
The value of ρ for SARS was in the range of [0.5, 0.8], we took in the absence of more studies.3, 9 In the sensitivity analysis, we would consider ρ from 0.5 to 1. As the formula was symmetry, the range, that is, [0.5, 1], covers all possible values of ρ. Lipsitch et al 10 showed that the average of is 8.4 days for SARS, while in the early outbreaks was higher (the average value was 10.0 days), and they suggested the sensitivity analysis interval as . Imai et al 11 claimed that the case study reported in Chan's research 4 indicated that 2019‐nCoV has a much shorter. However, we could not yet obtain any solid estimation about the value of as the number of samples was too small and the questionnary survey did not sufficiently cover the interests about genration time. Therefore, we mainly concentrated on (days) and (days), and took sensitivity analysis with the same interval 8, 12 as suggested by Lipsitch et al.10
As shown in Table 1, the basic reproduction number fell between 2.8 and 3.3 based on the People's Daily Reports and fell between 3.2 and 3.9 on the basis of the Northeastern University Reports.2 The estimated value of R0 by the Reports of the Northeastern University was similar to the value estimated by Read et al ,8 which was in the range of [3.6, 4.0]. Our estimated values were higher than the ones ([2.1, 3.5], with a median value 2.6) by Imai et al.11 In accordance with the currently preliminary estimations, the transmissibility of 2019‐nCoV was close to SARS. For example, the basic reproduction number of SARS by Lipsitch et al 10 was [2.2, 3.6], and the average basic reproduction number of SARS by Riely et al 12 was 2.7 (95% CI 2.2 to 3.7), but if considering the superspreading events, this average value increased up to 3.4. The basic reproduction number of SARS by Wallinga and Teunis 13 was from 3.1 to 4.2, which was not lower than our pessimistic result. Therefore, if we rely on the People's Daily Reports, the basic reproduction number of 2019‐nCoV was not higher than SARS, or even slightly lower than the basic reproduction number of SARS predicted by some other research teams. Even with the more predictions by the Northeastern University Reports, the basic reproduction number of 2019‐nCoV was only slightly higher than SARS. It was a controllable disease with moderate to high transmissibility. Concerning the previous experiences in fighting with SARS, the spreading of 2019‐nCoV could be quickly reduced (probably in 2 or 3 weeks) through timely and effective control measures by government.
Table 1.
The basic reproduction numbers and the corresponding key parameters
| Data sources | Tg | Y(t) | t | R0 |
|---|---|---|---|---|
| People's Daily Reports | 8.4 | 2820 | 48 | 2.83 |
| People's Daily Reports | 10.0 | 2820 | 48 | 3.28 |
| Northeastern University Reports | 8.4 | 4050 | 43 | 3.22 |
| Northeastern University Reports | 10.0 | 4050 | 43 | 3.78 |
| Northeastern University Reports | 8.4 | 12 700 | 47 | 3.34 |
| Northeastern University Reports | 10.0 | 12 700 | 47 | 3.93 |
This article is being made freely available through PubMed Central as part of the COVID-19 public health emergency response. It can be used for unrestricted research re-use and analysis in any form or by any means with acknowledgement of the original source, for the duration of the public health emergency.
Figure 1 shows the sensitivity analysis of the three key parameters. Under the worst case (, , ), the estimated R0 was 5.2; under the best case (, , ), the estimated R0 was 2.3. Because R0 was sensitive to the generation time, with the accumulation of epidemiological survey data, the estimation of generation time would be more accurate, thus providing a more precise estimation of the basic reproduction number.
Figure 1.
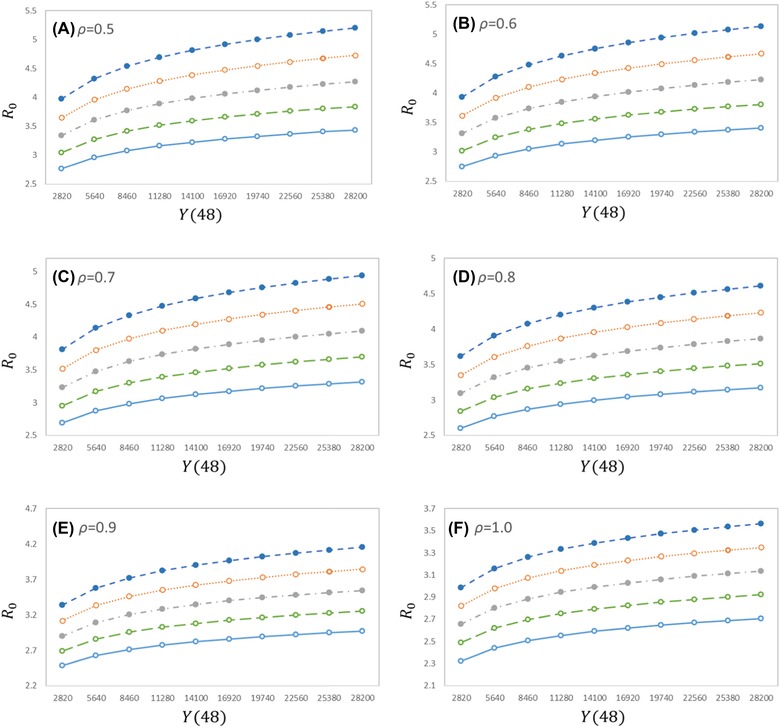
Impacts of different key parameters on the estimated basic reproduction numbers. The x‐axis is the number of cases with symptoms at t = 48; (A)–(F) correspond to the six different scenarios for , the five curves in each figure from top to bottom correspond to the five different cases for Tg = 12, 11, 10, 9, 8
4. DISCUSSION
Considering the extreme cases, the basic reproduction number was in the range of [2.3, 5.2], but we thought it should be in the range of [2.8, 3.9]. Based on the data of the People's Daily Reports, the prediction of the basic reproduction number was in the range of 2.8 and 3.3, and this range became [3.2, 3.9] when the data were based on the Northeastern University Reports.2 Even with the pessimistic estimation, the basic reproduction number of 2019‐nCoV was only slightly higher than SARS, fully equipped with controllable condition. Many known basic reproduction numbers were higher than 2019‐nCoV, for example, Zika virus was 1.4‐6.6 ,14 Middle East respiratory syndrome was 2.0‐6.7,15 and smallpox was 3.5‐6.0.16 In other words, 2019‐nCoV does not have particularly outstanding transmissibility.
The value of basic reproduction number was most sensitive to the generation time , and thus we hope the more accurate estimation of the generation time based on the accumulation of epidemiological survey data would further improve the quality of the estimation of R0. The number of confirmed cases obtained from different sources varied widely. Since a significant proportion of patients with 2019‐nCoV had mild symptoms, which could be healed without entering the hospital, there might be a large number of patients not in the official confirmed list. Consequently, we suggested it to be more prudent. For example, the design of control measure should refer to the more pessimistic estimation (based on the Northeastern University Reports) rather than the more optimistic one (based on the People's Daily Reports). Our model assumes that the individuals in exposed state did not have or have very lower level infectiousness (according to SARS), however, it was possible that for 2019‐nCoV, individuals in the exposed state still had considerable infectiousness. Such possible difference was already taken into account by varying the value of ρ.
It was needed to be emphasized that the method used in this article was a preliminary estimation under the premise of largely insufficient data. In order to have a better estimation of the basic reproduction number and effective reproduction number, as well as predicting the trend of epidemic transmission, we not only need to know precise epidemiological determinants, but also need to improve the model itself by further considering the diversity in susceptibilities and contact probabilities of people in different ages and genders, the different spreading mechanisms in hospitals and communities, the effects of regional population density and human mobility, and so on.17, 18, 19, 20.
From the dynamic perspective, , where k is the average number of contacts to susceptible individuals of an infected individual per day, β is the transmission probability through a contact between an infected individual and a susceptible individual, and D is the effective time period allowing an infected individual to infect susceptible individuals. The government's control policy and individuals’ prevention behaviors were to reduce these parameters, and to eventually make the effective reproduction number Rt below 1. According to our results, if could be reduced by 3/4 (to its 1/4), 2019‐nCoV could be effectively controlled. Staying at home and cancelled meetings could decrease the frequency of contacts between infected and susceptible individuals. Wearing masks and washing hands could reduce the transmission probability β. If the individuals exhibit the suspected symptoms or have contacts with the high‐risk groups, the corresponding medical observation and the isolation with other individuals were needed, which would shorten the effective infectious time period D. Restrictions on transportation, extension of winter holiday, and the cancellation of various conferences also aimed at reducing the effective reproductive number. Based on the preliminary information, a considerable amount of people infected with 2019‐nCoV only show mild symptoms, and thus they had the same mobility as healthy people in principle. There were also some preliminary epidemiological findings suggesting that infected cases had infectiousness during the exposed period. These reasons, together with the delayed responses by Wuhan government, lead to a fiercer outbreak of 2019‐nCoV than SARS. On the contrary, reducing the traveling and avoiding the meetings, in the meanwhile, wearing masks and washing hands frequently would suppress the effects caused by mild symptoms and exposed state with infectiousness. Relying on the Chinese experiences in fighting with SARS, we believed that 2019‐nCoV would be effectively controlled soon.
In conclusion, the SEIR model is employed to describe the dynamical process of 2019‐nCoV spreading, and based on the collected data of 2019‐nCoV, the basic reproduction number is predicted in this article a little higher than the SARS, which suggests that 2019‐nCoV is of a moderate to high transmissibility. In order to control the further extension of 2019‐nCoV quickly, more effective and timely control measures are required. In the process of prediction, some parameters related to the early stage of SARS transmission were used, and meanwhile it shows that the basic reproduction number is a little sensitive to the generation time. Thus, the microscopic survey about the transmission processes is needed to further improve the quality of predictions.
CONFLICTS OF INTEREST
The authors declare no conflict of interest.
Zhou T, Liu Q, Yang Z, et al. Preliminary prediction of the basic reproduction number of the Wuhan novel coronavirus 2019‐nCoV. J Evid Based Med. 2020;13:3–7. 10.1111/jebm.12376
Funding information
National Natural Science Foundation of China; Grant Numbers: 61433014, 11975071, 71771213, 91846301, 71790615, and 71774168; Fundamental Research Funds for the Central Universities and the Hunan Science and Technology Plan; Grant Numbers: 2017RS3040 and 2018JJ1034.
Contributor Information
Quanhui Liu, Email: quanhuiliu@scu.edu.cn.
Xin Lu, Email: xin.lu@flowminder.org.
Wei Zhang, Email: zhangwei@wchscu.cn.
REFERENCES
- 1. Adnerson RM. May RM, Infectious Diseases of Humans: Dynamics and Control. Oxford: Oxford University Press, 1991. [Google Scholar]
- 2. Chinazzi M, Davis JT, Gioannini C, et al. Series reports entitled “preliminary assessment of the international spreading risk associated with the 2019 novel coronavirus outbreak in Wuhan City.” Unpublished, 2020.
- 3. Donnelly CA, Ghani AC, Leung GM, et al. Epidemiological determinants of spread of causal agent of severe acute respiratory syndromein Hong Kong. Lancet. 2003;361:1761–1766. [DOI] [PMC free article] [PubMed] [Google Scholar]
- 4. Chan JFW, Yuan S, Kok KH, et al. A familial cluster of pneumonia associated with the 2019 novel coronavirus indicating person‐to‐person transmission: a study of a family cluster. Lancet. 2020. 10.1016/S0140-6736(20)30154-9 [DOI] [PMC free article] [PubMed] [Google Scholar]
- 5. Pastor‐Satorras R, Castellano C, Mieghem PV, et al. Epidemic processes in complex networks. Rev Mod Phys. 2015;87(3):925–979. [Google Scholar]
- 6. Wallinga J, Lipsitch M. How generation intervals shape the relationship between growth rates and reproductive numbers. Proc R Soc B: Biol Sci. 2007;274(1609):599–604. [DOI] [PMC free article] [PubMed] [Google Scholar]
- 7. Imai N, Dorigatti I, Cori A, et al. Series reports entitled “Estimating the potential total number of novel coronavirus in Wuhan City, China.” Unpublished.
- 8. Read JM, Bridgen JRE, Cummings DAT, et al. Novel coronavirus 2019‐nCoV: early estimation of epidemiological parameters and epidemic predictions. Preprint. MedRXiv. 2020. 10.1101/2020.01.23.20018549. [DOI] [PMC free article] [PubMed] [Google Scholar]
- 9. Leo YS, Chen M, Heng BH, et al. Severe acute respiratory syndrome—Singapore 2003. Morb Mortal Weekly Report. 2003;52(18):405–432. [PubMed] [Google Scholar]
- 10. Lipsitch M, Cohen T, Cooper B, et al. Transmission dynamics and control of severe acute respiratory syndrome. Science. 2003;300(5627):1966–1970. [DOI] [PMC free article] [PubMed] [Google Scholar]
- 11. Imai N, Cori A, Dorigatti I, et al. Transmissibility of 2019‐nCoV. Unpublished, 2020.
- 12. Riley S. Transmission dynamics of the etiological agent of SARS in Hong Kong: impact of public health interventions. Science. 2003;300(5627):1961–1966. [DOI] [PubMed] [Google Scholar]
- 13. Wallinga J, Teunis P. Different epidemic curves for severe acute respiratory syndrome reveal similar impacts of control measures. Am J Epidemiol. 2004;160(6):509–517. [DOI] [PMC free article] [PubMed] [Google Scholar]
- 14. Lessler J, Chaisson LH, Kucirka LM, et al. Assessing the global threat from Zika virus. Science. 2016;353:aaf8160. [DOI] [PMC free article] [PubMed] [Google Scholar]
- 15. Majumder MS, Rivers C, Lofgren E, et al. Estimation of MERS‐coronavirus reproductive number and case fatality rate for the spring 2014 Saudi Arabia outbreak: insights from publicly available data. PLoS Curr. 2014;6 http://10.1371/currents.outbreaks.98d2f8f3382d84f390736cd5f5fe133c [DOI] [PMC free article] [PubMed] [Google Scholar]
- 16. Eichner M, Dietz K. Transmission potential of smallpox: estimates based on detailed data from an outbreak. Am J Epidemiol. 2003;158(2):110–117. [DOI] [PubMed] [Google Scholar]
- 17. Balcan D, Gonçalves B, Hu H, et al. Modeling the spatial spread of infectious diseases: the Global Epidemic and Mobility computational model. J Com Sci. 2010;1(3):132–145. [DOI] [PMC free article] [PubMed] [Google Scholar]
- 18. Brockmann D, Helbing D. The hidden geometry of complex, network‐driven contagion phenomena. Science. 2013;342(6164):1337–1342. [DOI] [PubMed] [Google Scholar]
- 19. Bengtsson L, Gaudart J, Lu X, et al. Using mobile phone data to predict the spatial spread of cholera. Sci Rep. 2015;5:8923. [DOI] [PMC free article] [PubMed] [Google Scholar]
- 20. Liu QH, Ajelli M, Aleta A, et al. Measurability of the epidemic reproduction number in data‐driven contact networks. Proc Natl Acad Sci USA. 2018;115(50):12680–12685. [DOI] [PMC free article] [PubMed] [Google Scholar]