

Abstract
Background
As the outbreak of coronavirus disease 2019 (COVID-19) progresses, epidemiological data are needed to guide situational awareness and intervention strategies. Here we describe efforts to compile and disseminate epidemiological information on COVID-19 from news media and social networks.
Methods
In this population-level observational study, we searched DXY.cn, a health-care-oriented social network that is currently streaming news reports on COVID-19 from local and national Chinese health agencies. We compiled a list of individual patients with COVID-19 and daily province-level case counts between Jan 13 and Jan 31, 2020, in China. We also compiled a list of internationally exported cases of COVID-19 from global news media sources (Kyodo News, The Straits Times, and CNN), national governments, and health authorities. We assessed trends in the epidemiology of COVID-19 and studied the outbreak progression across China, assessing delays between symptom onset, seeking care at a hospital or clinic, and reporting, before and after Jan 18, 2020, as awareness of the outbreak increased. All data were made publicly available in real time.
Findings
We collected data for 507 patients with COVID-19 reported between Jan 13 and Jan 31, 2020, including 364 from mainland China and 143 from outside of China. 281 (55%) patients were male and the median age was 46 years (IQR 35–60). Few patients (13 [3%]) were younger than 15 years and the age profile of Chinese patients adjusted for baseline demographics confirmed a deficit of infections among children. Across the analysed period, delays between symptom onset and seeking care at a hospital or clinic were longer in Hubei province than in other provinces in mainland China and internationally. In mainland China, these delays decreased from 5 days before Jan 18, 2020, to 2 days thereafter until Jan 31, 2020 (p=0·0009). Although our sample captures only 507 (5·2%) of 9826 patients with COVID-19 reported by official sources during the analysed period, our data align with an official report published by Chinese authorities on Jan 28, 2020.
Interpretation
News reports and social media can help reconstruct the progression of an outbreak and provide detailed patient-level data in the context of a health emergency. The availability of a central physician-oriented social network facilitated the compilation of publicly available COVID-19 data in China. As the outbreak progresses, social media and news reports will probably capture a diminishing fraction of COVID-19 cases globally due to reporting fatigue and overwhelmed health-care systems. In the early stages of an outbreak, availability of public datasets is important to encourage analytical efforts by independent teams and provide robust evidence to guide interventions.
Funding
Fogarty International Center, US National Institutes of Health.
Introduction
As the outbreak of coronavirus disease 2019 (COVID-19) is rapidly expanding in China and beyond, with the potential to become a worldwide pandemic,1 real-time analyses of epidemiological data are needed to increase situational awareness and inform interventions.2 Previously, real-time analyses have shed light on the transmissibility, severity, and natural history of an emerging pathogen in the first few weeks of an outbreak, such as with severe acute respiratory syndrome (SARS), the 2009 influenza pandemic, and Ebola.3, 4, 5, 6 Analyses of detailed line lists of patients are particularly useful to infer key epidemiological parameters, such as the incubation and infectious periods, and delays between infection and detection, isolation, and reporting of cases.3, 4 However, official individual patient data rarely become publicly available early on in an outbreak, when the information is most needed.
Building on our previous experience collating news reports to monitor transmission of Ebola virus,7 here we present an effort to compile individual patient information and subnational epidemic curves on COVID-19 from a variety of online resources. Data were made publicly available in real time and were used by the infectious disease modelling community to generate and compare epidemiological estimates relevant to interventions. We describe the data generation process and provide an early analysis of age patterns of COVID-19, case counts across China and internationally, and delays between symptom onset, admissions to hospital, and reporting, for cases reported until Jan 31, 2020.
Research in context.
Evidence before this study
An outbreak of coronavirus disease 2019 (COVID-19) was recognised in early January, 2020, in Wuhan City, Hubei province, China. The new virus is thought to have originated from an animal-to-human spillover event linked to seafood and live-animal markets. The infection has spread locally in Wuhan and elsewhere in China, despite strict intervention measures implemented in the region where the infection originated on Jan 23, 2020. More than 500 patients infected with COVID-19 outside of mainland China have been reported between Jan 1 and Feb 14, 2020. Although laboratory testing for COVID-19 quickly ramped up in China and elsewhere, information on individual patients remains scarce and official datasets have not been made publicly available. Patient-level information is important to estimate key time-to-delay events (such as the incubation period and interval between symptom onset and visit to a hospital), analyse the age profile of infected patients, reconstruct epidemic curves by onset dates, and infer transmission parameters. We searched PubMed for publications between Jan 1, 1990, and Feb 6, 2020, using combinations of the following terms: (“coronavirus” OR “2019-nCoV”) AND (“line list” OR “case description” OR “patient data”) AND (“digital surveillance” OR “social media” OR “crowd-sourced data”). The search retrieved one relevant study on Middle East respiratory syndrome coronavirus that mentioned FluTrackers in their discussion, a website that aggregates epidemiological information on emerging pathogens. However, FluTrackers does not report individual-level data on COVID-19.
Added value of this study
To our knowledge, this is the first study that uses crowdsourced data from social media sources to monitor the COVID-19 outbreak. We searched DXY.cn, a Chinese health-care-oriented social network that broadcasts information from local and national health authorities, to reconstruct patient-level information on COVID-19 in China. We also queried international media sources and national health agency websites to collate data on international exportations of COVID-19. We describe the demographic characteristics, delays between symptom onset, seeking care at a hospital or clinic, and reporting for 507 patients infected with COVID-19 reported until Jan 31, 2020. The overall cumulative progression of the outbreak is consistent between our line list and an official report published by the Chinese national health authorities on Jan 28, 2020. The estimated incubation period in our data aligns with that of previous work. Our dataset was made available in the public domain on Jan 21, 2020.
Implications of all the available evidence
Crowdsourced line-list data can be reconstructed from social media data, especially when a central resource is available to curate relevant information. Public access to line lists is important so that several teams with different expertise can provide their own insights and interpretations of the data, especially in the early phase of an outbreak when little information is available. Publicly available line lists can also increase transparency. The main issue with the quality of patient-level data obtained during health emergencies is the potential lack of information from locations overwhelmed by the outbreak (in this case, Hubei province and other provinces with weaker health infrastructures). Future studies based on larger samples of patients with COVID-19 could explore in more detail the transmission dynamics of the outbreak in different locations, the effectiveness of interventions, and the demographic factors driving transmission.
Methods
Study design and Chinese data sources
In this population-level observational study, we used crowdsourced reports from DXY.cn, a social network for Chinese physicians, health-care professionals, pharmacies, and health-care facilities established in 2000. This online platform is providing real-time coverage of the COVID-19 outbreak in China, obtained by collating and curating reports from news media, government television, and national and provincial health agencies. The information reported includes time-stamped cumulative counts of COVID-19 infections, outbreak maps, and real-time streaming of health authority announcements in Chinese (directly or through state media).8 Every report is linked to an online source, which can be accessed for more detailed information on individual cases.
These are publicly available, de-identified patient data reported directly by public health authorities or by state media. No patient consent was needed and no ethics approval was required.
Data compilation
We closely monitored updates on DXY.cn between Jan 20, 2020, and Jan 31, 2020, to extract key information on individual patients in near real-time, and reports of daily case counts. For individual-level patient data, we used descriptions from the original source in Chinese to retrieve age, sex, province of identification, travel history, reporting date, dates of symptom onset and seeking care at a hospital or clinic, and discharge status, when available. Individual-level patient data were formatted into a line-list database for further quantitative analysis. Individual-level patient data were entered from DXY.cn by a native Chinese speaker (KS), who also generated an English summary for each patient. Entries were checked by a second person (JC). Since DXY.cn primarily provides information on patients reported in China, we also compiled additional information on internationally exported cases of COVID-19. We obtained data for 21 countries outside of mainland China (Australia, Cambodia, Canada, France, Germany, Hong Kong, India, Italy, Japan, Malaysia, Nepal, Russia, Singapore, South Korea, Sri Lanka, Taiwan, Thailand, United Arab Emirates, the UK, the USA, and Vietnam). We gathered and cross-checked data for infected patients outside of China using several sources, including global news media (Kyodo News, Straits Times, and CNN), official press releases from each country's Ministry of Health, and disease control agencies.
In addition to detailed information on individual patients, we reconstructed the daily progression of reported patients in each province of China from Jan 13, until Jan 31, 2020. We used the daily outbreak situation reports communicated by provincial health authorities, covered by state television and media, and posted on DXY.cn. All patients in our databases had a laboratory confirmed SARS coronavirus 2 (SARS-CoV-2) infection.
Our COVID-19 database was made publicly available as a Google Sheet, disseminated via Twitter on Jan 21, 2020, and posted on the website of Northeastern University, (Boston, MA, USA) on Jan 24, 2020, where it is updated in real time. Data used in this analysis, frozen at Jan 31, 2020, are available online as a spreadsheet.
Statistical analysis
We assessed the age distribution of all patients with COVID-19 by discharge status. We adjusted the age profile of Chinese patients by the population of China. We used 2016 population estimates from the Institute for Health Metrics and Evaluation9 to calculate the relative risk (RR) of infection with COVID-19 by age group. To calculate the RR, we followed the method used by Lemaitre and colleagues10 to explore the age profile of influenza, where RR for age group i is defined as
where Ci is the number of cases in age group i and Ni is the population size of age group i.
To estimate trends in the strength of case detection and interventions, we analysed delays between symptom onset and visit to a health-care provider, at a hospital or clinic, and from seeking care at a hospital or clinic to reporting, by time period and location. We considered the period before and after Jan 18, 2020, when media attention and awareness of the outbreak became more pronounced.11 We used non-parametric tests to assess differences in delays between seeking care at a hospital or clinic and reporting between locations (Wilcoxon test to compare two locations and Kruskall–Wallis test to compare three or more locations).
We estimated the duration of the incubation period on the basis of our line list data. We analysed a subset of patients returning from Wuhan who had spent less than a week in Wuhan, to ensure a narrowly defined exposure window. The incubation period was estimated as the midpoint between the time spent in Wuhan and the date of symptom onset.
We did all analyses in R (version 3.5.3). We considered p values of less than 0·05 to be significant.
Role of the funding source
The funder had no role in study design, data compilation, data analysis, data interpretation, or writing of the report. All authors had access to the data, and had final responsibility for the decision to submit for publication.
Results
Our line list comprised 507 patients reported from Jan 13, to Jan 31, 2020, including 364 (72%) from mainland China and 143 (28%) from outside of China (table ). Our sample captured 5·2% of 9826 COVID-19 cases reported by WHO on Jan 31, 2020. The sex ratio was skewed towards males. In mainland China, five of 30 provinces were represented, with 133 (26%) patients reported by Beijing, 87 (17%) by Shaanxi, 41 (8%) by Hubei (capital city is Wuhan), 19 (4%) by Tianjin, and 22 (4%) by Yunnan. Of 435 patients with known relation to Wuhan city, most reported a travel history to the city (135 [30%]) or were residents of the city (152 [30%]), while 80 (16%) had no direct relation to the city. 122 (24%) patients, all reported in Beijing, had no information about their recent history with Wuhan.
Table.
Characteristics of patients with COVID-19 included in the crowdsourced line list
| Patients (n=507) | ||
|---|---|---|
| Age, years | 46 (35–60) | |
| Sex | ||
| Male | 281 (55%) | |
| Female | 201 (40%) | |
| Data missing | 25 (5%) | |
| Location | ||
| Mainland China | 364 (72%) | |
| Beijing | 133 (26%) | |
| Shaanxi | 87 (17%) | |
| Hubei* | 41 (8%) | |
| Tianjin | 22 (4%) | |
| Yunnan | 19 (4%) | |
| International cases, reported outside of mainland China | 143 (28%) | |
| Relation to Wuhan | ||
| Visited Wuhan | 153 (30%) | |
| Resident of Wuhan | 152 (30%) | |
| None | 80 (16%) | |
| Unknown† | 122 (24%) | |
| Disease outcome: death at time of reporting | 40 (8%) | |
Data are median (IQR) or n (%). Data are publicly available on the Laboratory for the Modeling of Biological + Socio-technical systems website and on our frozen spreadsheet. COVID-19=coronavirus disease 2019.
Including 32 from Wuhan.
All patients with unknown relation to Wuhan were reported by Beijing Municipal Health Commission, Beijing, China.
The age distribution of COVID-19 cases was skewed towards older age groups with a median age of 45 years (IQR 33–56) for patients who were alive or who had an unknown outcome at the time of reporting (figure 1 ). The median age of patients who had died at the time of reporting was 70 years (IQR 65–81). Few patients (13 [3%]) were younger than 15 years. Adjustment for the age demographics of China confirmed a deficit of infections among children, with a RR below 0·5 in patients younger than 15 years (figure 1). The RR measure indicated a sharp increase in the likelihood of reported COVID-19 among people aged 30 years and older.
Figure 1.
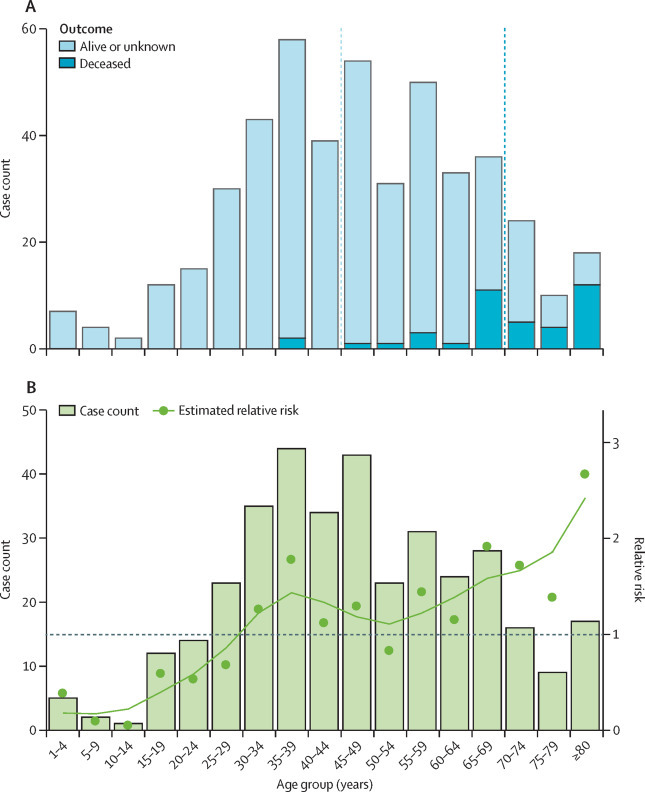
Age distribution of patients with COVID-19 from crowdsourced data
(A) All 507 cases by disease outcome (alive or unknown or deceased at time of reporting); vertical bars are case counts in each age group and the dotted lines show the median age for patients who were alive or with unknown outcomes at the time of reporting and those who had died at the time of reporting. (B) Relative risk by 5-year age band for 364 cases reported in China. The observed data are shown by bars and the estimated relative risk is shown by datapoints and a spline-smoothed curve. COVID-19=coronavirus disease 2019.
A timeline of cases in our crowdsourced patient line list is shown by date of onset in figure 2 , indicating an acceleration of reported cases by Jan 13, 2020. The outbreak progression based on the crowdsourced patient line list was consistent with the timeline published by China Center for Disease Control and Prevention (CDC) on Jan 28, 2020,12 which is based on a more comprehensive database of more than 6000 patients with COVID-19. Since Jan 23, 2020, the cumulative number of cases has slowed down in the crowdsourced and China CDC curves (figure 2), which probably reflects the delay between disease onset and reporting. The median reporting delay was 5 days (IQR 3–8) in our data.
Figure 2.
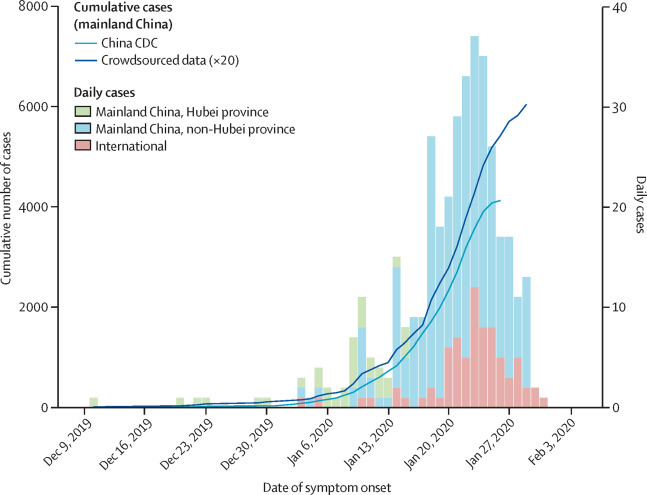
Daily timeline of the COVID-19 epidemic based on crowdsourced data and official sources, by location
All data are by date of symptom onset. Cumulative curves are shown for the official China CDC data (published on Jan 28, 2020), and for the crowdsourced data. Crowdsourced data have been rescaled and multiplied by 20 to enable clear comparison with the official China CDC data. Histograms are daily case count, based on crowdsourced data for Hubei province, mainland China non-Hubei province, and cases outside of mainland China. CDC=Centers for Disease Control. COVID-19=coronavirus disease 2019.
Province-level epidemic curves are shown by reporting date in figure 3 . As of Jan 31, 2020, 16 (52%) of 30 provinces in mainland China had reported more than 100 confirmed cases. The apparent rapid growth of newly reported cases between Jan 18, and Jan 31, 2020, in several provinces outside of Hubei province is consistent with sustained local transmission.
Figure 3.
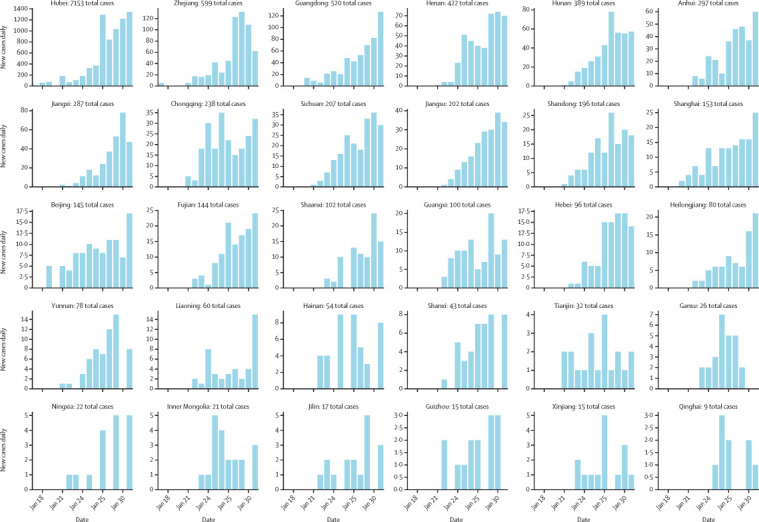
Daily timeline of the COVID-19 epidemic at the provincial level in China, during January, 2020
Vertical bars show the daily counts of new reported cases, with provinces sorted by total number of reported cases. The timeline for each province is reconstructed on the basis of daily outbreak situation reports provided by provincial health authorities and posted on DXY.cn and are true as of Jan 31, 2020. COVID-19=coronavirus disease 2019.
Across the study period, the median delay between symptom onset and seeking care at a hospital or clinic was 2 days (IQR 0–5 days) in mainland China (figure 4 ). This delay decreased from 5 days before Jan 18, 2020, to 2 days thereafter (Wilcoxon test p=0·0009). Some provinces, such as Tianjin and Yunnan had shorter delays (data by province not shown), while the early cases from Hubei province were characterised by longer delays in seeking care (median 0 days [IQR 0–1]).
Figure 4.
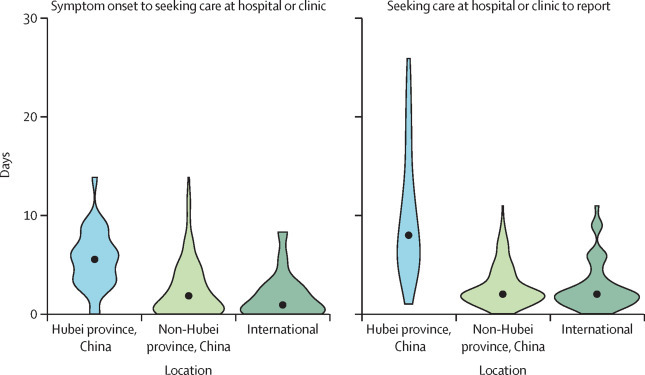
Delay between symptom onset and seeking care at a hospital or clinic (A) and between seeking care at a hospital or clinic and reporting (B) of COVID-19 cases, by location
Data are for the entire study period and include all cases reported between Jan 13 and Jan 31, 2020. Datapoints are medians, with the spread of data indicated by the filled shapes. All time intervals significantly differ between locations (Kruskall Wallis test, p<0·0001). COVID-19=coronavirus disease 2019.
The median delay between seeking care at a hospital or clinic and reporting was 2 days (IQR 2–5 days) in mainland China and decreased from 9 days before Jan 18, 2020, to 2 days thereafter (Wilcoxon test p<0·0001; figure 4). Similarly to delays in seeking care at a hospital or clinic, reporting was quickest in Tianjin and Yunnan (median 1 day [IQR 0–1]) and slowest in Hubei province (median 12 days [IQR 7–16]).
The median delay between symptom onset and seeking care at a hospital or clinic was 1 day (IQR 0–3) for international travellers, and shorter than for patients in Hubei province or the rest of mainland China (Kruskal–Wallis test p<0·0001; figure 4). Even in the period after Jan 18, 2020, when awareness of the outbreak increased, a shorter delay between symptom onset and seeking care at a hospital or clinic was seen for international patients than for those in mainland China (Wilcoxon test p<0·0001). For international cases, the delay between seeking care at a hospital or clinic and reporting was 2 days (IQR 1–4), also shorter than for mainland China (Wilcoxon test p<0·0001; figure 4).
On the basis of 33 patients with a travel history to Wuhan, we estimated the median incubation period for COVID-19 to be 4·5 days (IQR 3·0–5·5; appendix p 2).
Discussion
Information from patient line lists is crucial but difficult to obtain at the beginning of an outbreak. Here we have shown that careful compilation of crowdsourced reports curated by a long-standing Chinese medical social network provides a valuable picture of the outbreak of COVID-19 in real time. The outbreak timeline is consistent with aggregated case counts provided by health authorities. For comparison, China CDC published the first epidemic curve by symptom onset on Jan 28, 2020.12 Line lists provide unique information on the delays between symptom onset and detection by the health-care system, reporting delays, and travel histories. This information cannot be extracted from aggregated case counts published by official sources. Line list data can help assess the effectiveness of interventions and the potential for widespread transmission beyond the initial foci of infection. In particular, shorter delays between symptom onset and admission to hospital or seeking care in a hospital or clinic accelerate detection and isolation of cases, effectively shortening the infectious period.
A useful feature of our crowdsourced database was the availability of travel histories for patients returning from Wuhan, which, along with dates of symptom onset, allowed for estimation of the incubation period here and in related work.13, 14 A narrow window of exposure could be defined for a subset of patients who had a short stay in Wuhan, at a time when the epidemic was still localised to Wuhan. Several teams have used our dataset and datasets from others to estimate a mean incubation period for COVID-19 to be 5–6 days (95% CI 2–11).13, 14, 15, 16 Our own estimate (median 4·5 days [IQR 3·0–5·5]) is consistent with previous work that used other modelling approaches.13, 14, 15, 16 The incubation period is a useful parameter to guide isolation and contact tracing; based on existing data, the disease status of a contact should be known with near certainty after a period of observation of 14 days.13 Availability of a public dataset enables independent estimation of important epidemiological parameters by several teams, allowing for confirmation and cross-checking at a time when information can be conflicting and noisy.
An interesting finding in our data relates to the age distribution of patients. We found a heavy skew of infection towards older age groups, with substantially fewer children infected. This pattern could indicate age-related differences in susceptibility to infection, severe outcomes, or behaviour. However, a substantial portion of the patients in our database are travellers, a population that is usually predominantly adults (although does not exclude children). Furthermore, because patient data in our dataset were captured by the health system, they are biased towards the more severe spectrum of the disease, especially for patients from mainland China. Clinical reports have shown that severity of COVID-19 is associated with the presence of chronic conditions,16, 17 which are more frequent in older age groups. Nevertheless, we would also expect children younger than 5 years to be at risk of severe outcomes and to be reported to the health-care system, as is seen for other respiratory infections.18
Biological differences could have a role in shaping these age profiles. A detailed analysis of one of the early COVID-19 clusters by Chan and colleagues19 revealed symptomatic infections in five adult members of the same household, while a child in the same household aged 10 years was infected but remained asymptomatic, potentially indicating biological differences in the risk of clinical disease driven by age. Previous immunity from infection with a related coronavirus has been speculated to potentially protect children from SARS,20, 21 and so might also have a role in COVID-19. In any case, if the age distribution of cases reported here was to be confirmed and the epidemic were to progress globally, we would expect an increase in respiratory mortality concentrated among people aged 30 years and older. This mortality pattern would be substantially different from the profile of the 2009 influenza pandemic, for which excess mortality was concentrated in those younger than 65 years.21
In our dataset, we saw a rapid increase in the number of people infected with COVID-19 in several provinces of China, consistent with local transmission outside of Hubei province. As of Jan 31, 2020, province-level epidemic curves are only available by date of reporting, rather than date of symptom onset, which usually inflates recent case counts if detection has increased. Furthermore, province-level data include both returning travellers from Hubei province (ie, importations) and locally acquired cases, which also usually inflate the apparent risk of local transmission. Notably, other lines of evidence suggest that local transmission is now well established outside of Hubei province, because travel increased just before the Chinese New Year on Jan 25, 2020, and before implementation of the travel ban in Wuhan.22 Accordingly, our own data include evidence of transmission clusters in non-travellers, with, for instance, a second-generation transmission event reported in Shaanxi on Jan 21, 2020.
Our study had several limitations, one of which was the data we used. Although all provinces in mainland China provide aggregated information on infections and deaths, individual-level patient descriptions are only available for a subset of provinces. Geographical coverage is heterogeneous in our line list, and we have a notable deficit of cases from Hubei province, the foci of the COVID-19 outbreak. We expect that little patient-level information is shared on social media by province-level and city-level health authorities in Wuhan and Hubei province because health systems are overwhelmed. For similar reasons, provinces with a large total case count at the end of January, 2020, or with a weaker health infrastructure, were under-represented in our line list, with the exception of Beijing. Other limitations in our data include severity (only patients who had severe enough symptoms to seek care were captured) and changes in case definition. A series of epidemiological criteria were required for COVID-19 testing, including travel history to Wuhan within the past 2 weeks; residence in Wuhan within the past 2 weeks; contact with individuals from Wuhan (with fever and respiratory symptoms) within the past 2 weeks; and being part of an established disease cluster. Some of these criteria (eg, relation to Wuhan) were relaxed over time (appendix). As a result, we have an over-representation of travel-related cases in our database.
The reproduction number is an important quantity for outbreak control. We refrained from estimating this parameter because reporting changes could bias estimates relying on epidemic growth rates. Furthermore, our dataset captured cases all over China and does not reflect transmission patterns in any particular location. A mean reproduction number of 2·5–2·7 has previously been estimated on the basis of the volume of importations of international cases in the pre-intervention period in Wuhan.11
We recognise that, although our data source is useful and timely, it should not replace official statistics. Manual compilation of detailed line lists from media sources is highly time consuming and is not sustainable when case counts reach several thousands. Here we provide detailed data on 507 patients when the official case count was over 9000 by Jan 31, 2020, representing a sample of approximately 5% of reported cases and a much smaller proportion of the full spectrum of COVID-19 cases, which include mild infections. A crowdsourced system would not be expected to catch all cases, especially if many cases are too mild to be captured by the health-care system, digital surveillance, or social media. Notably, DXY.cn does not generate data outside of traditional surveillance systems but rather provides a channel of rapid communication between the public and health authorities. In turn, our approach has helped extract and repackage information from health authorities into an analytical format, which was not available elsewhere.
At the time of writing, efforts are underway to coordinate compilation of COVID-19 data from online sources across several academic teams. Ultimately, we expect that a line list of patients will be shared by government sources with the global community; however, data cleaning and access issues might take a prohibitively long time to resolve. For the west African Ebola outbreak, a similarly coordinated effort to publish a line list took 2 years.23 Given the progression of the COVID-19 outbreak, such a long delay would be counterproductive.
Overall, the novelty of our approach was to rely on a unique source for social media and news reports in China, which aggregated and curated relevant information. This approach facilitated entry of robust and standard data on clinical and demographic information. Reassuringly, DXY.cn maintains a special section dedicated to debunking fake news, myths, and rumours about the COVID-19 outbreak. Looking to the future, collection of patient data in the context of emergencies could include information on whether patients are identified through contact tracing or because they seek care on their own. Furthermore, data interpretability could be improved by gathering more quantitative information on how case definitions are used in practice.
In conclusion, crowdsourced epidemiological data can be useful to monitor emerging outbreaks, such as COVID-19 and, as previously, Ebola virus.7 These efforts can help generate and disseminate detailed information in the early stages of an outbreak when little other data are available, enabling independent estimation of key parameters that affect interventions. Based on our small sample of patients with COVID-19, we note an intriguing age distribution, reminiscent of that of SARS, which warrants further epidemiological and serological studies. We also report early signs that the response is strengthening in China on the basis of a decrease in case detection time, and rapid management of travel-related infections that are identified internationally. This is an early report of a rapidly evolving situation and the parameters discussed here could change quickly. In the coming weeks, we will continue to monitor the epidemiology of this outbreak using data from news reports and official sources.
For an example of an online source see https://ncov.dxy.cn/ncovh5/view/pneumonia
For the WHO situation report as of Jan 31, 2020, see https://www.who.int/docs/default-source/coronaviruse/situation-reports/20200131-sitrep-11-ncov.pdf?sfvrsn=de7c0f7_4
For the Laboratory for the Modeling of Biological + Socio-technical systems website at Northeastern University see https://www.mobs-lab.org/2019ncov.html
For the spreadsheet of patient-level data until Jan 31, 2020, see https://docs.google.com/spreadsheets/d/1Gb5cyg0fjUtsqh3hl_L-C5A23zIOXmWH5veBklfSHzg/edit?usp=sharing
For DXY website see DXY.cn
Data sharing
All data used in this report have been made publicly available on the Laboratory for the Modeling of Biological + Socio-technical systems website of Northeastern University. The available data include daily case counts of COVID-19 by reporting date and Chinese province, and a de-identified line list of patients with COVID-19. The line list includes geographical location (country and province), reporting date, dates of symptom onset and seeking care at a hospital or clinic, relation to Wuhan, discharge status when known, an English summary of the case description from media sources, and a link to the original source of data.
Acknowledgments
Acknowledgments
The study was funded by the in-house research division of the Fogarty International Center. CV and KS acknowledge support from the Bill & Melinda Gates Foundation. The findings and conclusions in this study are those of the authors and do not necessarily represent the official position of the US National Institutes of Health or US Department of Health and Human Services.
Contributors
KS and CV contributed to the study design. KS and JC contributed to the data compilation. KS, JC, and CV contributed to data analysis. KS and JC contributed to the design and drawing of figures. KS, JC, and CV contributed to the writing of the manuscript.
Declaration of interests
We declare no competing interests.
Supplementary Material
References
- 1.WHO . World Health Organization; Geneva: 2020. Statement on the second meeting of the International Health Regulations (2005) Emergency Committee regarding the outbreak of novel coronavirus (2019-nCoV)https://www.who.int/news-room/detail/30–01–2020-statement-on-the-second-meeting-of-the-international-health-regulations-(2005)-emergency-committee-regarding-the-outbreak-of-novel-coronavirus-(2019-ncov) [Google Scholar]
- 2.Rivers C, Chretien JP, Riley S, et al. Using “outbreak science” to strengthen the use of models during epidemics. Nat Commun. 2019;10 doi: 10.1038/s41467-019-11067-2. [DOI] [PMC free article] [PubMed] [Google Scholar]
- 3.Chowell G, Bertozzi SM, Colchero MA, et al. Severe respiratory disease concurrent with the circulation of H1N1 influenza. N Engl J Med. 2009;361:674–679. doi: 10.1056/NEJMoa0904023. [DOI] [PubMed] [Google Scholar]
- 4.Chowell G, Echevarría-Zuno S, Viboud C, et al. Characterizing the epidemiology of the 2009 influenza A/H1N1 pandemic in Mexico. PLoS Med. 2011;8 doi: 10.1371/journal.pmed.1000436. [DOI] [PMC free article] [PubMed] [Google Scholar]
- 5.Fraser C, Donnelly CA, Cauchemez S, et al. Pandemic potential of a strain of influenza A (H1N1): early findings. Science. 2009;324:1557–1561. doi: 10.1126/science.1176062. [DOI] [PMC free article] [PubMed] [Google Scholar]
- 6.Lipsitch M, Cohen T, Cooper B, et al. Transmission dynamics and control of severe acute respiratory syndrome. Science. 2003;300:1966–1970. doi: 10.1126/science.1086616. [DOI] [PMC free article] [PubMed] [Google Scholar]
- 7.Cleaton JM, Viboud C, Simonsen L, Hurtado AM, Chowell G. Characterizing Ebola transmission patterns based on internet news reports. Clin Infect Dis. 2016;62:24–31. doi: 10.1093/cid/civ748. [DOI] [PMC free article] [PubMed] [Google Scholar]
- 8.DXY.cn; Pneumonia. 2020. http://3g.dxy.cn/newh5/view/pneumonia (in Chinese).
- 9.Institute for Health Metrics and Evaluation . Institute for Health Metrics and Evaluation; Seattle, WA: 2020. Global health data exchange.ghdx.healthdata.org [Google Scholar]
- 10.Lemaitre M, Carrat F. Comparative age distribution of influenza morbidity and mortality during seasonal influenza epidemics and the 2009 H1N1 pandemic. BMC Infect Dis. 2010;10:162. doi: 10.1186/1471-2334-10-162. [DOI] [PMC free article] [PubMed] [Google Scholar]
- 11.MRC Centre for Global Infectious Disease Analysis . Imperial College London; London: 2020. News/2019-nCoV.https://www.imperial.ac.uk/mrc-global-infectious-disease-analysis/news--wuhan-coronavirus/ [Google Scholar]
- 12.China Center for Disease Control and Prevention . China Center for Disease Control and Prevention; Beijing: 2020. 2019 epidemic update and risk assessment of 2019 novel coronavirus.http://www.chinacdc.cn/yyrdgz/202001/P020200128523354919292.pdf [Google Scholar]
- 13.Backer JA, Klinkenberg D, Wallinga J. Incubation period of 2019 novel coronavirus (2019-nCoV) infections among travellers from Wuhan, China, 20–28 January 2020. Euro Surveill. 2020;25 doi: 10.2807/1560-7917.ES.2020.25.5.2000062. [DOI] [PMC free article] [PubMed] [Google Scholar]
- 14.Lauer SA, Grantz KH, Bi Q, et al. The incubation period of 2019-nCoV from publicly reported confirmed cases: estimation and application. medRxiv. 2020 doi: 10.1101/2020.02.02.20020016. published online Feb 4. (preprint). [DOI] [PMC free article] [PubMed] [Google Scholar]
- 15.Zhao A, Ran J, Musa SS, et al. Preliminary estimation of the basic reproduction number of novel coronavirus (2019-nCoV) in China, from 2019 to 2020: a data-driven analysis in the early phase of the outbreak. bioRxiv. 2020 doi: 10.1101/2020.01.23.916395v1. published online Jan 24. (preprint). [DOI] [PMC free article] [PubMed] [Google Scholar]
- 16.Li Q, Guan X, Wu P, et al. Early transmission dynamics in Wuhan, China, of novel coronavirus-infected pneumonia. N Engl J Med. 2020 doi: 10.1056/NEJMoa2001316. published online Jan 29. [DOI] [PMC free article] [PubMed] [Google Scholar]
- 17.Huang C, Wang Y, Li X, et al. Clinical features of patients infected with 2019 novel coronavirus in Wuhan, China. Lancet. 2020 doi: 10.1016/S0140-6736(20)30183-5. published online Jan 24. [DOI] [PMC free article] [PubMed] [Google Scholar]
- 18.Greenbaum AH, Chen J, Reed C, et al. Hospitalizations for severe lower respiratory tract infections. Pediatrics. 2014;134:546–554. doi: 10.1542/peds.2014-0244. [DOI] [PubMed] [Google Scholar]
- 19.Chan JF, Yuan S, Kok KH, et al. A familial cluster of pneumonia associated with the 2019 novel coronavirus indicating person-to-person transmission: a study of a family cluster. Lancet. 2020 doi: 10.1016/S0140-6736(20)30154-9. published online Jan 24. [DOI] [PMC free article] [PubMed] [Google Scholar]
- 20.Leung GM, Hedley AJ, Ho LM, et al. The epidemiology of severe acute respiratory syndrome in the 2003 Hong Kong epidemic: an analysis of all 1755 patients. Ann Intern Med. 2004;141:662–673. doi: 10.7326/0003-4819-141-9-200411020-00006. [DOI] [PubMed] [Google Scholar]
- 21.Simonsen L, Spreeuwenberg P, Lustig R, et al. Global mortality estimates for the 2009 Influenza Pandemic from the GLaMOR project: a modeling study. PLoS Med. 2013;10 doi: 10.1371/journal.pmed.1001558. [DOI] [PMC free article] [PubMed] [Google Scholar]
- 22.Du W, Wang L, Cauchemez S, et al. Risk of 2019 novel coronavirus importations throughout China prior to the Wuhan quarantine. medRxiv. 2020 doi: 10.1101/2020.01.28.20019299. published online Feb 4. (preprint). [DOI] [Google Scholar]
- 23.Agua-Agum J, Ariyarajah A, Aylward B, et al. Exposure patterns driving ebola transmission in west Africa: A retrospective observational study. PLoS Med. 2016;13 doi: 10.1371/journal.pmed.1002170. [DOI] [PMC free article] [PubMed] [Google Scholar]
Associated Data
This section collects any data citations, data availability statements, or supplementary materials included in this article.
Supplementary Materials
Data Availability Statement
All data used in this report have been made publicly available on the Laboratory for the Modeling of Biological + Socio-technical systems website of Northeastern University. The available data include daily case counts of COVID-19 by reporting date and Chinese province, and a de-identified line list of patients with COVID-19. The line list includes geographical location (country and province), reporting date, dates of symptom onset and seeking care at a hospital or clinic, relation to Wuhan, discharge status when known, an English summary of the case description from media sources, and a link to the original source of data.