

Abstract
Background
Cruise ships carry a large number of people in confined spaces with relative homogeneous mixing. On 3 February, 2020, an outbreak of COVID-19 on cruise ship Diamond Princess was reported with 10 initial cases, following an index case on board around 21-25th January. By 4th February, public health measures such as removal and isolation of ill passengers and quarantine of non-ill passengers were implemented. By 20th February, 619 of 3700 passengers and crew (17%) were tested positive.
Methods
We estimated the basic reproduction number from the initial period of the outbreak using SEIR models. We calibrated the models with transient functions of countermeasures to incidence data. We additionally estimated a counterfactual scenario in absence of countermeasures, and established a model stratified by crew and guests to study the impact of differential contact rates among the groups. We also compared scenarios of an earlier versus later evacuation of the ship.
Results
The basic reproduction rate was initially 4 times higher on-board compared to the  in the epicentre in Wuhan, but the countermeasures lowered it substantially. Based on the modeled initial
  of 14.8, we estimated that without any interventions within the time period of 21 January to 19 February, 2920 out of the 3700 (79%) would have been infected. Isolation and quarantine therefore prevented 2307 cases, and lowered the
  to 1.78. We showed that an early evacuation of all passengers on 3 February would have been associated with 76 infected persons in their incubation time.
Conclusions
The cruise ship conditions clearly amplified an already highly transmissible disease. The public health measures prevented more than 2000 additional cases compared to no interventions. However, evacuating all passengers and crew early on in the outbreak would have prevented many more passengers and crew from infection.
Keywords: Coronavirus, SARS-CoV-2, Basic reproduction number, Isolation and quarantine, Incubation time, Evacuation
Introduction
Cruise ships carry a large number of people in confined spaces with relative homogeneous mixing over a period of time that is longer than for any other mode of transportation.1 Thus, cruise ships present a unique environment for transmission of human-to-human transmitted infections. The association of acute respiratory infections (ARI) incidence in passengers is statistically significant with season, destination and duration of travel.2 In February 2012, an outbreak of respiratory illness occurred on the cruise ship off Brazil, resulting in 16 hospitalizations due to severe ARI and one death.3 In May 2009, a dual outbreak of pandemic (H1N1) 2009 and influenza A (H3N2) on a cruise ship occurred: of 1970 passengers and 734 crew members, 82 (3.0%) were infected with pandemic (H1N1) 2009 virus, and 98 (3.6%) with influenza A (H3N2) virus.4 Four subsequent cases were epidemiologically linked to passengers but no evidence of sustained transmission to the community or passengers on the next cruise was reported.4 In September 2000 an outbreak of influenza-like illness was reported on a cruise ship sailing off the Australian coast with over 1100 passengers and 400 crew on board, coinciding with the peak influenza period in Sydney.5 The cruise morbidity was high with 40 passengers hospitalized, two of whom died. A total of 310 passengers (37%) reported suffering from an influenza-like illness.
In December 2019, a novel coronavirus, SARS-CoV-2, emerged in Wuhan, China and rapidly spread within China and then to various global cities with high interconnectivity with China.6,7 The resulting ARI due to this coronavirus, a disease now coined COVID-19, is thought to be mainly transmitted by respiratory droplets from infected people. The mean serial interval of COVID-19 is 7.5 days (95% CI, 5.3 to 19) and the initial estimate for the basic reproductive number  was 2.2 (95% CI, 1.4 to 3.9),8 although higher
  have since been reported with a mean of more than 3.9 On 18 February 2020, China’s CDC published their data of the first 72 314 cases including 44 672 confirmed cases.10 About 80% of the confirmed cases were reported to be mild disease or less severe forms of pneumonia, 13.8% severe and 4.7% critically ill. Risk factors for severe disease outcomes are older age and co-morbidities. The progression to acute respiratory distress syndrome occurs approximately 8-12 days after onset of first symptoms, with lung abnormalities on chest CT showing greatest severity approximately 10 days after initial onset of symptoms.11–13,14 Evidence is mounting that also mildly symptomatic or even asymptomatic cases can transmit the disease.15,16
On 3rd February, 2020, an outbreak of COVID-19 was reported on Cruise Ship Princess Diamond off the Japanese coast, with initially 10 persons confirmed to be infected with the virus. The number has since ballooned into the largest coronavirus outbreak outside of mainland China. By 19th February, 619 of 3700 passengers and crew (17%) were tested positive. By end February, six persons had died. The outbreak was traced to a Hong Kong passenger who embarked on January 21st and disembarked on January 25th. After docking near New Taipei City, on January 31, the ship arrived in Yokohoma, Japan. By the following day, the Japanese health ministry ordered a 14-day quarantine for everyone on board and rushed to close its ports to all other cruise ships. The public health measures taken according to news reports and the media were removal of all PCR positive passengers and crew from the ship and their isolation in Japanese hospitals. The remaining test-negative passengers and crew remained on board. Passengers were quarantined in their cruise ship cabins, and only allowed out of the cabin for one hour per day. By 20th February, the decision to evacuate was made and more than 3000 passengers left the ship. Most were air-evacuated by their respective countries.10
The cruise ship with a COVID-19 index case onboard between the 21-25th January serves as a good model to study its potential to spread in a population that is more homogenously mixed, compared to the more spatially variable situation in Wuhan.
We set out to study the empirical data of COVID-19 confirmed infections on the Cruise ship Diamond Princess, to estimate the basic reproduction number ( ) under cruise ship conditions, the response effectiveness of the quarantine and removal interventions, and compare scenarios of an earlier and later evacuation of the ship.
Methods
We used data on confirmed cases on the cruise ship as published on a daily basis by public sources17,18 to calibrate a model and estimate the basic reproduction number  from the time sequence and amplitude of the case rates observed. COVID-19 is thought to have been introduced by an index case from Hong Kong visiting the ship between the 21st to 25th of January, 2020. We thus used the date of 21st January 2020 as the first time point, t = 0, assuming the index case was infectious from the first day on the ship. The estimates of
  and the associated Covid-19 incidence on the cruise ship was derived using a compartmental model estimating the dynamics of the number of susceptible (
 ), exposed (
 ), infected (
 ), and recovered (
 ) individuals, adapted but modified from a published COVID-19 study.19 We analyzed two instances of the model assuming respectively: (1) a homogenous population (3700 individuals), and (2) a stratified population of crew (1000 individuals) and guests (2700 individuals). The model used a relationship between the daily reproductive number,
 , and
, and  to infer the transmissibility and contact rate across the whole cruise ship population by the relationship:
 |
where the infectious period equals to one over the recovery rate ( ),
), 
In the homogeneous model, the infectious period, i, of COVID-19 was set to be 10 days based on previous findings.8 In the situation of no removal (ill persons taken off the ship to be isolated in a Japanese hospital), the incubation period (or, the latent period),  was estimated to be approximately 5 days (ranging from 2 to 14 days).20 In order to model the removal/isolation and quarantine interventions, we implemented time dependent removal and contact rates as described in Table 1. We performed additional sensitivity analysis reducing the
  to 3.7, an estimate of the average value across mainland China studies of COVID-19.9
Table 1.
Model parameter description and values. Start time (t = 0) the 20th of January.
| Parameters | Explanation (unit) | Estimated to |
|---|---|---|
 | Overall transmissibility and contact rate (1/day) |  |
 | ||
 | Incubation period (days) | 5 days |
| i | Infectious period or time to removal (days) |  |
 | ||
 | Total number of people onboard (persons) | 3700 |
 | Transmissibility and contact rate crew (1/day) |  |
 | ||
 | Transmissibility and contact rate guests to guests (1/day) |  |
 | ||
 | Transmissibility and contact rate guests to crew (1/day) |  |
 | ||
 g g | Total number of guests onboard (persons) | 2700 |
 c c | Total number of crew onboard (persons) | 1000 |
We further estimated a counterfactual scenario of the infections dynamics assuming no interventions were implemented, in particular no removal and subsequent isolation of ill persons. We assumed an infectious period of 10 days, with a contact rate remaining the same as in the initial phase of the outbreak. Additionally, in the stratified model of crew and guests, the contact rate was assumed to be different due to the assumption that crew could not be easily quarantined as they had to continue their services on board for all the passengers and possibly had more homogeneous mixing with all the passengers, whereas passengers may be mixing more within their preferred circles and areas. We kept the transient change in the contact rate and the removal of all PCR confirmed patients starting from the 2nd and the 5th of February respectively as in the first model. Parameters are described in Table 1.
The model describing a homogeneous population onboard can be described by:
 |
where  denote all susceptible people on the cruise ship,
  all exposed,
  all infected and
  all recovered or removed, and where
  denotes the whole population.
The model describing a stratified population onboard can be described by:
 |
where  denotes susceptible,
  exposed,
  infected and
  recovered or removed,
  , and the subscript
  and
and  are indicating guest and crew respectively. Overall, we assume mortality is negligible.
Models with interventions were calibrated to reports of total infection occurrence, while models simulating the counterfactual scenarios where left with the naïve parameter settings (no countermeasures). The net effects of the countermeasures where estimated as the difference between the counterfactual scenario and the model with the interventions. Model parameters are described in Table 1. The effectiveness of the countermeasures was estimated by calibration of the model to data.
We here also present estimations of the plausible consequences of a hypothetical third intervention strategy, whereby all individuals onboard would have been evacuated either on 3rd of February or 19th of February. We estimated and presented the number of latent cases on 3rd February evacuation and on 19th February, 2020.
Results
Using the SEIR model assuming relatively homogenous mixing of all people onboard, we calibrated the predicted cumulative number of infections from the model to the observed cumulative number of infections among all people onboard and estimated the initial  to be 14.8. This translates into an estimate of
  (the daily reproduction rate) to 1.48. To derive this estimate we calibrated functions describing transient change in the
  as a result of changes in contact rate and the removal of symptomatic infections. The parameter values of contact rate, quarantine interventions and removal presented in Table 1 are the results of the calibration to the observed cumulative incidence data. The contact rate between persons on the cruise ship was calibrated to give the best fit to data with a reduction of 70% by the quarantine countermeasure with onset 3rd February, 2020. The transient function of removal and isolation of infected cases with an onset on 5th February, 2020, reduced the infectious period from 10 to 4 days, and substantially reduced the transmission and sub-sequent infections on the ship. In Figure 1 we present the change in
  based on the relationship between
  and
and  and how it is affected by the transient countermeasures of quarantine and removal of ill patients from the model. Here
  should be interpreted as the basic reproductive rate in a totally naïve population on the Diamond Princess (i.e. same contact rate), and not the actual basic reproductive number over time on the cruise ship. The
  was 14.8 initially and then
  declined to a stable 1.78 after the quarantine and removal interventions were initiated (Figure 1).
Figure 1.

The estimated basic reproduction number,  , on the cruise ship and its change over time as a result of the transient interventions of quarantine and removal of infectious cases. The
  given here assumes one index case in a totally naïve population, although that is not the case on the ship, we use it here to illustrate how the
  is sensitive to the interventions, but still substantially large to fuel a continuation of the epidemic. The grey line indicates
The predicted cumulative number of cases over time from this model described the observed cases well, but overestimated the cumulative case incidence rate initially (Figure 2). This allowed to compensate for reporting bias in the initial phase, given that the proportion of testing of all passengers was patchy while at the end of the study (19th February, 2020) the testing of passengers had a higher coverage and was more complete. The modelled cumulative number of cases on 19 February, 2020, is 613 out of the 3700 people at risk, while the observed reported number of cases is 619. The counterfactual scenario assuming homogenous rates among crew and guests without any interventions (no removal off the ship or isolation of ill persons nor any quarantine measures for the remaining passengers on boat), estimated the number of cumulative cases to be 2920 out of the 3700 after 30 days, that is by 19th of February (Figure 2). The net effect of the combined interventions was estimated to prevent a total number of 2307 cases by 19th February, 2020 (Figure 2).
Figure 2.
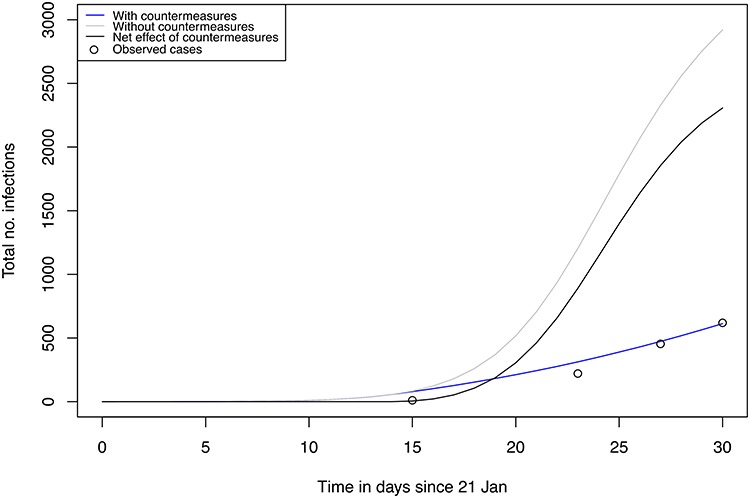
Predicted total number of infections using model 1 (no stratification) for the realistic situation with interventions (blue), counterfactual scenario without intervention (grey) and the net effect of the interventions (black).
In a sensitivity analysis we modified the  to 3.7 (and consequently
  ) as this has been reported the average basic reproduction number from studies of COVID-19 in China.9 However, from our simulation, even in the absence of any intervention, such a low
  cannot explain the rapid growth of incident cases on the cruise ship (Figure 3). This sensitivity scenario excluded countermeasures from the model making it unrealistic that such a low
  value could be the true value in the cruise ship situation with confined spaces and high homogeneous mixing of the same persons. The estimate with the lower
  value also omitted to consider the strong interventions put into place, making it even more unrealistic.
Figure 3.
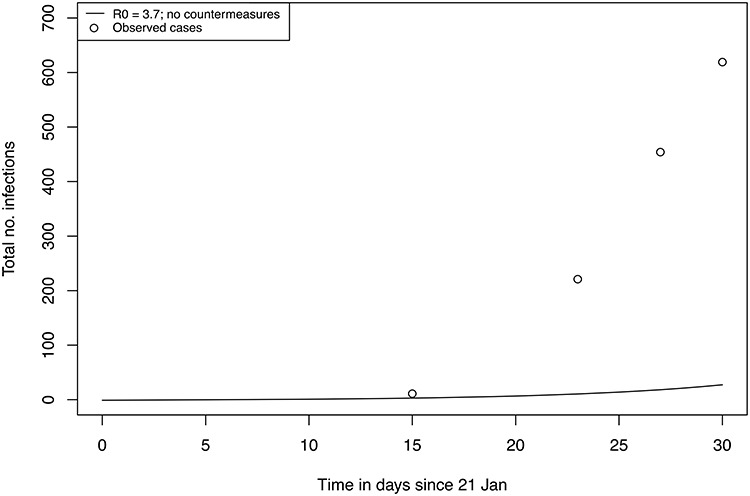
Sensitivity analysis: predicting total number of infections using a model without interventions with  set to 3.7 with index case 21th January (bottom). Observed reports of cumulative cases are marked as ‘o’.
We additionally modeled a scenario stratified by crew and guests whereby we assumed the parameter values of transmission risk to be lower for crew to guest than for guest to crew (Table 1). The predicted cumulative number of infected crew and guests by 19th of February from this model was 168 out of 1000 (16.8%) and 464 out of 2700 (17.2%), respectively (Figure 4). The total number of cumulative cases by 19th of February predicted from this model was 632, close to the observed number of cases of 619. The predicted cumulative incidence rates were overestimated for crew while underestimated for guests based on available tests results at the time of writing (Figure 4). These data still need to be validated against the empiric data of test results in all crew and passengers which should soon become available.
Figure 4.
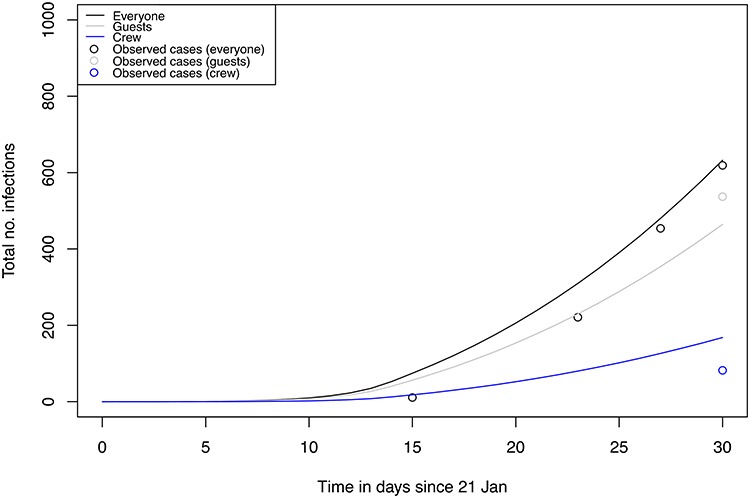
Predicted total number of infections using a model stratified into crew and guest for the realistic situation with interventions. Total population onboard (black), guests (grey), crew (blue). Observed total case numbers of total (black), crew (blue) and guest (grey) are marked as ‘o’.
Instead of keeping all passengers on board, another option would have been to evacuate all individuals onboard the cruise ship earlier, and allow them to go home for a potential quarantine in their respective home countries. We modeled that an evacuation by 3rd February, 2020, would have resulted in 76 latent cases (cases during the incubation time), while an evacuation by 19th February would have resulted in 246 latent cases.
Discussion
Modelling the COVID-19 on-board outbreak reveals important insights into the epidemic risk and effectiveness of public health measures. We found that the reproductive number of COVID-19 in the cruise ship situation of 3700 persons confined to a limited space was around 4 times higher than in the epicenter in Wuhan, where  was estimated to have a mean of 3.7.9 Interestingly, a rough estimation of the population per square km on this 18-deck ship is 286 by 62 meters (0.32 km2). Assuming that only 50% of decks are being used, approximately 24 400 persons are confined per km2 on a ship compared to approximately 6000 persons per km2 (9 000 000/1528) in urban Wuhan. This means that the population density was about 4 times higher on the cruise ship. Thus, both R0 and contact rate are dependent on population density, as also suggested by previous research.21 In population-based models on observational data the population per square km is often substantially different, affecting the R0 and
  coefficient implicitly by changes in the contact rate expressed as:
 |
The local estimate of R0 can be divided into a localized contact rate and a multiplier that is necessary for moving from one population to another:
 , where pd is the population density multiplier. In our case it was approximated to 4. Here the contact rate is related to a contact rate in a defined population in a certain area and the population density multiplier modifies the contact rate when moving across different local populations and geographical areas representing heterogeneity in population density. In the case of the cruise ship, the potential relationship of
  to population density thus appears to be mainly attributed by the contact rate and mixing effects. This information is also important for other settings characterized by high population densities.
With such a high  , we estimated that without any interventions within the time period of 21st January to 19th February 2920 out of the 3700 (79%) would have been infected, assuming relatively homogenous mixing between all people on board.
The quarantine and removal interventions launched when the outbreak was confirmed (3rd February and 5th of February) substantially lowered the contact rate and reduced the cumulative case burden by an estimated 2307 cases by 19th February. We note, however, that the longer time span of simulation beyond 19th February, assuming people would stay on the boat, would reduce the net effect of the intervention substantially. We further note that an earlier evacuation would have corresponded to disembarking a substantially lower number of latent undetectable infections (76 vs. 246), likely giving rise to some further transmission outside the ship.
We also found that contact rate of guest to guest and crew appeared higher than the contact rate from guest to crew, perhaps driven by high transmission rates within cabins. However, testing of crew was delayed, and there was a testing bias towards testing more passengers than crew. Hence our analysis needs to be revisited when all data is available.
The limitations of our study include our lack of data on the lag time between onset of symptoms, the timing of testing and potential delay to the availability of test results. Due to the large number of people, not everyone was tested, and we suspect that the timing of the test results do not totally tally with real-time onset of cases. We had no access to data on incident cases in crew versus passengers, nor any data on whether there was clustering of cases around certain nationalities or crew members. Furthermore, although the Hong Kong passenger was assumed to be the index case, it could well have been possible that there was more than one index case on board who could have contributed to transmission, and this would have lowered our estimated R0. Lastly, our models are based on human-to-human transmission and do not take into account the possibility that fomites, or water systems with infected feces, contributed to the outbreak.
The interventions that included the removal of all persons with confirmed COVID-19 disease combined with the quarantine of all passengers substantially reduced the anticipated number of new COVID-19 cases compared to a scenario without any interventions (17% attack rate with intervention versus 79% without intervention) and thus prevented a total number of 2307 additional cases by 19th February. However, the main conclusion from our modelling is that evacuating all passengers and crew early on in the outbreak would have prevented many more passengers and crew members from getting infected. A scenario of early evacuation at the time of first detection of the outbreak (3 February) would have resulted in only 76 latent infected persons during the incubation time (with potentially still negative tests). A late evacuation by 19th February would have resulted in about 246 infected persons during their incubation time. These data need to be confirmed by empiric data of testing all evacuated persons after 19th February, and may be an overestimate as we assumed a stable  after quarantine was instituted. However, the
  probably declined over time, as the implementation of quarantine measures were incrementally implemented leading to better quarantine standards towards the end of the quarantine period.
In conclusion, the cruise ship conditions clearly amplified an already highly transmissible disease.  is related to population density, and is particularly driven by contact rate and mixing effects, and this explains the high
  in the first weeks before countermeasures were initiated. Population densities and mixing need to be taken into account in future modeling of the COVID-19 outbreak in different settings. Early evacuation of all passengers on a cruise ship- a situation with confined spaces and high intermixing- is recommended as soon as an outbreak of COVID-19 is confirmed.
Author contributions
JR and AWS conceived the study. JR developed the model and run the analysis. HS advised on model development, and helped with the figures. AWS advised on model parameters. AWS wrote the first draft. All authors wrote the final manuscript.
Funding
None
Declaration of interest
None declared.
References
- 1. Young BE, Wilder-Smith A. Influenza on cruise ships. J Travel Med 2018; 25. [DOI] [PubMed] [Google Scholar]
- 2. Pavli A, Maltezou HC, Papadakis A et al. Respiratory infections and gastrointestinal illness on a cruise ship: a three-year prospective study. Travel Med Infect Dis 2016; 14:389–97. [DOI] [PubMed] [Google Scholar]
- 3. Borborema SE, Silva DB, Silva KC et al. Molecular characterization of influenza B virus outbreak on a cruise ship in Brazil 2012. Rev Inst Med Trop Sao Paulo 2014; 56:185–9. [DOI] [PMC free article] [PubMed] [Google Scholar]
- 4. Ward KA, Armstrong P, McAnulty JM, Iwasenko JM, Dwyer DE. Outbreaks of pandemic (H1N1) 2009 and seasonal influenza a (H3N2) on cruise ship. Emerg Infect Dis 2010; 16:1731–7. [DOI] [PMC free article] [PubMed] [Google Scholar]
- 5. Brotherton JM, Delpech VC, Gilbert GL et al. A large outbreak of influenza a and B on a cruise ship causing widespread morbidity. Epidemiol Infect 2003; 130:263–71. [DOI] [PMC free article] [PubMed] [Google Scholar]
- 6. Bogoch II, Watts A, Thomas-Bachli A, Huber C, Kraemer MUG, Khan K. Potential for global spread of a novel coronavirus from China. J Travel Med 2020; 27. [DOI] [PMC free article] [PubMed] [Google Scholar]
- 7. Zhao S, Zhuang Z, Cao P et al. Quantifying the association between domestic travel and the exportation of novel coronavirus (2019-nCoV) cases from Wuhan, China in 2020: a correlational analysis. J Travel Med 2020; 27. [DOI] [PMC free article] [PubMed] [Google Scholar]
- 8. Li Q, Guan X, Wu P et al. Early transmission dynamics in Wuhan, China, of novel coronavirus-infected pneumonia. N Engl J Med 2020. [DOI] [PMC free article] [PubMed] [Google Scholar]
- 9. Liu Y, Gayle AA, Wilder-Smith A, Rocklov J. The reproductive number of COVID-19 is higher compared to SARS coronavirus. J Travel Med 2020; 27. [DOI] [PMC free article] [PubMed] [Google Scholar]
- 10.https://www.aljazeera.com/news/2020/02/coronavirus-cases-aboard-diamond-princess-disconcerting-200221041420214.html.
- 11. Huang C, Wang Y, Li X et al. Clinical features of patients infected with 2019 novel coronavirus in Wuhan, China. Lancet 2020; 395:497–506. [DOI] [PMC free article] [PubMed] [Google Scholar]
- 12. Chen N, Zhou M, Dong X et al. Epidemiological and clinical characteristics of 99 cases of 2019 novel coronavirus pneumonia in Wuhan, China: a descriptive study. Lancet 2020; 395:507–13. [DOI] [PMC free article] [PubMed] [Google Scholar]
- 13. Holshue ML, DeBolt C, Lindquist S et al. First case of 2019 novel coronavirus in the United States. N Engl J Med 2020; 382:929–36. [DOI] [PMC free article] [PubMed] [Google Scholar]
- 14. Pan F, Ye T, Sun P et al. Time course of lung changes on chest CT during recovery from 2019 novel coronavirus (COVID-19) pneumonia. Radiology 2020; 200370. [DOI] [PMC free article] [PubMed] [Google Scholar]
- 15. Bai Y, Yao L, Wei T et al. Presumed asymptomatic carrier transmission of COVID-19. JAMA 2020. [DOI] [PMC free article] [PubMed] [Google Scholar]
- 16. Rothe C, Schunk M, Sothmann P et al. Transmission of 2019-nCoV infection from an asymptomatic contact in Germany. N Engl J Med 2020; 382:970–71. [DOI] [PMC free article] [PubMed] [Google Scholar]
- 17. The Princess Cruises’ official website : Cruises P. Princess Cruises: Diamond Princess Coronavirus & Quarantine Updates - Notices & Advisories Princess Cruises website: @PrincessCruises;2020. https://www.princess.com/news/notices_and_advisories/notices/diamond-princess-update.html(accessed 24 Feb 2020).
- 18. National Institute of Infectious Diseases, Japan, official website : Field Briefing: Diamond Princess COVID-19 Cases, 20 Feb Update;2020https://www.niid.go.jp/niid/en/2019-ncov-e/9417-covid-dp-fe-02.html(accessed 21 Feb 2020).
- 19. Wu JT, Leung K, Leung GM. Nowcasting and forecasting the potential domestic and international spread of the 2019-nCoV outbreak originating in Wuhan, China: a modelling study. Lancet 2020. [DOI] [PMC free article] [PubMed] [Google Scholar]
- 20. European Union, official website : The EU's Response to COVID-19; 2020[Updated Monday Feb 24]https://ec.europa.eu/commission/presscorner/detail/en/qanda_20_307(accessed 18 Feb 2020).
- 21. Hu H, Nigmatulina K, Eckhoff P. The scaling of contact rates with population density for the infectious disease models. Math Biosci 2013; 244:125–34. [DOI] [PubMed] [Google Scholar]