

Summary
Exposure to influenza virus triggers a complex cascade of events in the human host. In order to understand more clearly the evolution of this intricate response over time, human volunteers were inoculated with influenza A/Wisconsin/67/2005 (H3N2), and then had serial peripheral blood samples drawn and tested for the presence of 25 major human cytokines. Nine of 17 (53%) inoculated subjects developed symptomatic influenza infection. Individuals who will go on to become symptomatic demonstrate increased circulating levels of interleukin (IL)‐6, IL‐8, IL‐15, monocyte chemotactic protein (MCP)‐1 and interferon (IFN) gamma‐induced protein (IP)‐10 as early as 12–29 h post‐inoculation (during the presymptomatic phase), whereas challenged patients who remain asymptomatic do not. Overall, the immunological pathways of leucocyte recruitment, Toll‐like receptor (TLR)‐signalling, innate anti‐viral immunity and fever production are all over‐represented in symptomatic individuals very early in disease, but are also dynamic and evolve continuously over time. Comparison with simultaneous peripheral blood genomics demonstrates that some inflammatory mediators (MCP‐1, IP‐10, IL‐15) are being expressed actively in circulating cells, while others (IL‐6, IL‐8, IFN‐α and IFN‐γ) are probable effectors produced locally at the site of infection. Interestingly, asymptomatic exposed subjects are not quiescent either immunologically or genomically, but instead exhibit early and persistent down‐regulation of important inflammatory mediators in the periphery. The host inflammatory response to influenza infection is variable but robust, and evolves over time. These results offer critical insight into pathways driving influenza‐related symptomatology and offer the potential to contribute to early detection and differentiation of infected hosts.
Keywords: cytokines, humans, influenza, viral infection
Introduction
Influenza infection is one of the leading causes of acute respiratory illness worldwide and causes substantial morbidity and mortality 1. The ongoing global impact of clinical influenza infections, coupled with the continued evolution of the virus resulting in periodic pandemics, highlights the need for better understanding of the nature of the host response to this ubiquitous and ever‐changing pathogen. Analysis of how humans respond to influenza infection is key to understanding virus‐mediated immunopathology and resultant clinical disease 2. Respiratory viruses such as influenza are some of the most common causes of airway inflammation and acute lung injury, but mechanisms underlying this injury have not been fully elucidated. Influenza infection initiates in the host a cascade of increased biosynthesis of proinflammatory mediators (cytokines and chemokines) by airway inflammatory and epithelial cells 3. These chemotactic, pro‐ and anti‐inflammatory cytokines have pleiotropic effects that, in a concentration‐dependent manner, mediate proliferation, differentiation, receptor and leucocyte recruitment, can act as secondary messengers, hormones, ligands and function in positive and negative feedback. Studies involving influenza H1N1 pdm09 found correlations between disease severity and circulating levels of interleukin (IL)‐6, IL‐10, interferon (IFN)‐γ‐induced protein (IP‐10) and monocyte chemotactic protein‐1 (MCP‐1) 4. Another recent study of individuals with influenza H7N9 infection revealed elevated levels of IP‐10, IL‐2, IL‐6, IL‐17 5, 6. Fatal outcomes following human infection with avian influenza A virus (H5N1) are associated with high levels of inflammatory cytokines in the peripheral blood, including IP‐10, MCP‐1 (CCL2), monokine induced by IFN‐γ (MIG; CXCL9) and IL‐8 7, 8, while other recent data demonstrate that agents which modulate some of these key host inflammatory pathways show promise as adjunctive therapies 9. Thus, understanding the mechanisms of chemokine and cytokine responses to influenza infection is of high priority, as excessive cytokine production seems to contribute directly to clinical pathogenesis.
Unfortunately, the bulk of available data regarding cytokine expression in influenza‐infected humans are from single time‐point clinical studies, although there are some limited temporal human data focusing on a small number of specific targets 10, 11, 12. Such studies, while powerful, fail to shed light on very early (presymptomatic) time‐points in disease, or on the development and progression of host responses over time. In order to characterize more accurately and completely the temporal dynamics of the host response to acute influenza infection, we have utilized our own human influenza challenge cohorts with a defined inoculation event and typical seasonal influenza virus strain coupled with frequent serial sampling in order to explore the ability of modern immunological techniques to identify and classify accurately individuals with both symptomatic and asymptomatic responses to influenza infection as early as possible following viral exposure, as well as to explore the potential mechanisms and pathogenic impact of these responses through simultaneous monitoring of gene expression in peripheral blood mononuclear cells (PBMCs) 13.
Materials and methods
Viral challenge
For the human viral challenge study, in collaboration with hVivo Ltd (formerly Retroscreen Virology; London, UK), we inoculated intranasally 17 healthy volunteers aged 22–41 years (average age 27 years) with influenza A/Wisconsin/67/2005 (H3N2), as described in detail previously 13. All volunteers provided informed consent and underwent extensive pre‐enrolment health screening, and inclusion required negative baseline haemagglutination inhibition titres to the specific strain of influenza utilized in the study. After 24 h in quarantine, we instilled 106 50% tissue culture infective dose (TCID50) influenza A into bilateral nares of subjects using standard methods 14, 15. At predetermined intervals (every 8 h for the first 5 days following inoculation), we collected blood, serum and plasma. We obtained nasal lavage samples from each subject daily for qualitative viral culture and and/or quantitative influenza reverse transcription–polymerase chain reaction (RT–PCR) to assess viral shedding. Blood and nasal lavage collection continued throughout the duration of the quarantine. Symptom scores were tabulated twice daily throughout the study 13, 16, where subjects ranked upper respiratory and systemic symptoms (runny nose, sinus stuffiness, sneezing, sore throat, earache, cough, shortness of breath, malaise, myalgias, fever) on a scale of 0–3 of ‘no symptoms’, ‘just noticeable’, ‘bothersome but can still do activities’ and ‘bothersome and cannot do daily activities’. All subjects were negative by rapid antigen detection (BinaxNow Rapid Influenza Antigen; Inverness Medical Innovations Inc./Alere Inc., Waltham, MA, USA) at time of discharge, and no additional post‐challenge adverse events were reported.
Cytokine quantification
Serum chemokine and cytokine levels were evaluated using the Invitrogen human cytokine 25‐plex assay (Carlsbad, CA, USA), as per the manufacturer's instructions. Briefly, beads are conjugated to cytokine‐specific capture antibodies and added along with the sample of interest into the wells of a filter‐bottomed microplate. After washing the beads, biotinylated detector antibodies are added followed by addition of streptavidin‐R‐phycoerythrin (RPE). The streptavidin‐RPE binds to the biotinylated detector antibodies associated with the immune complexes on the beads, forming a four‐member solid‐phase sandwich. After washing to remove unbound streptavidin‐RPE, the beads are analysed on a Luminex detection system.
RNA purification and microarray analysis
For each challenge, we collected peripheral blood at 24 h prior to inoculation with virus (baseline), immediately prior to inoculation (prechallenge) and at set intervals following challenge as described 13. RNA was extracted at Expression Analysis (Durham, NC, USA) from whole blood using the PAXgene™ 96 Blood RNA Kit (PreAnalytiX, Valencia, CA, USA) employing the manufacturer's recommended protocol. Hybridization and microarray data collection was performed at Expression Analysis using the GeneChip® Human Genome U133A 2·0 Array (Affymetrix, Santa Clara, CA, USA).
Viral titration
Confluent monolayers of Madin–Darby canine kidney (MDCK) cells were inoculated with replicate (n = 4) serial 10‐fold dilutions of virus stocks or clinical samples (nasopharyngeal washes) in 96‐well microtitre format. After 90 min at 37°C in a humidified 5% CO2 incubator, the inocula were removed and the cells were washed with Iscove's medium (IM) and cultured for 6 days in a humidified incubator at 37°C and 5% CO2, followed by enumeration and calculation of TCID50 by standard practice 17.
Statistical analysis
Preprocessing
Prior to data log‐transformation, cytokine values above (0·3% of measured samples) or below (3% of samples) measurement range were imputed to either twice or half of the maximum or minimum value of any given cytokine, respectively.
Cytokine profile model
Our model for cytokine time–series assumes that a subset of subjects sharing a phenotype also share a cytokine time profile hidden within measurements. More specifically, we assume that due to subject‐to‐subject variability any observed time–series is a time‐shifted, amplitude‐shifted and scaled version of a phenotype‐specific cytokine profile that is, in addition, naturally subject to measurement noise. The Bayesian model, described fully in the Supporting information, estimates subject‐specific shifts and scale parameters and a phenotype‐specific subject‐shared cytokine profile function. For each cytokine two models are considered: symptomatic and asymptomatic profile models.
Symptom score correlation model
We can assess the level of collinearity between symptom scores and individual cytokines by simply computing Spearman's correlation coefficients between them. When symptom scores are a monotone function of some cytokine we obtain a correlation coefficient of either 1 or −1. Alternatively, we can try to predict symptom scores based on all cytokines using an ordinal regression model such as Bayesian rank‐likelihood regression 18. In order to avoid overfitting, the predictions of the regression model were obtained within the context of a leave‐one‐out (LOO) cross‐validation scheme. If the LOO‐based predictions correlate with symptom scores then there exists a non‐trivial linear combination of cytokines that also correlates with symptom scores. Model development and analyses were performed primarily using Matlab (The Mathworks, Inc., Natick, MA, USA). Student's t‐test, Mann–Whitney U‐test and χ2 test were used for univariate comparisons where appropriate. Correlations between immunological parameters (cytokine levels), symptoms and viral load were calculated using Spearman's rank correlation test. In all analyses a P‐value of < 0·05 was used to indicate statistical significance where appropriate.
Results
Temporal development of the host response to viral challenge
In our previously completed H3N2 (A/Wisconsin/67/2005) challenge trial, we inoculated 17 volunteers (mean age 27 years; range 22–41 years), of whom nine (53%) developed symptomatic influenza infection 13. For the nine symptomatic‐infected subjects, symptom onset began at an average of 45–49 h after inoculation, and they experienced maximal symptoms 85–93 h, on average, after inoculation followed by a slow steady improvement. Viral shedding increased rapidly, with an early peak at 48 h post‐inoculation followed by a comparatively more rapid decline compared to symptom resolution (Fig. 1). For the current study, we assayed 25 cytokines in peripheral blood at each of 17 different time‐points ranging from pre‐inoculation to the entire course of clinical disease and eventual symptom resolution. Levels of the various cytokines in peripheral blood exhibited significant variability among individuals and across time. This variability in the cytokine responses among individuals manifests quantitatively and, to a lesser degree, temporally. However, the character, direction, relative magnitude and shape of the temporal responses seen for each cytokine are remarkably conserved among symptomatic individuals. This can be visualized by examining a composite curve for all individuals which illustrates this conserved motif for each significantly altered cytokine (Supporting information, Fig. S1). The majority of this variation is quantitative in nature and can be dealt with by calculating fold change compared to baseline for each individual, cytokine and time‐point studied (Fig. 2), which reveals the overall conserved character of the host response.
Figure 1.
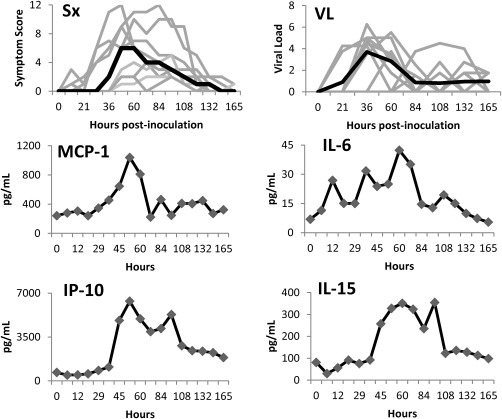
Temporal development of symptoms, viral shedding, and absolute levels of circulating cytokines in symptomatic subjects experimentally infected with influenza A virus. Time courses of individual subjects (light grey) and median values (black) are represented.
Figure 2.
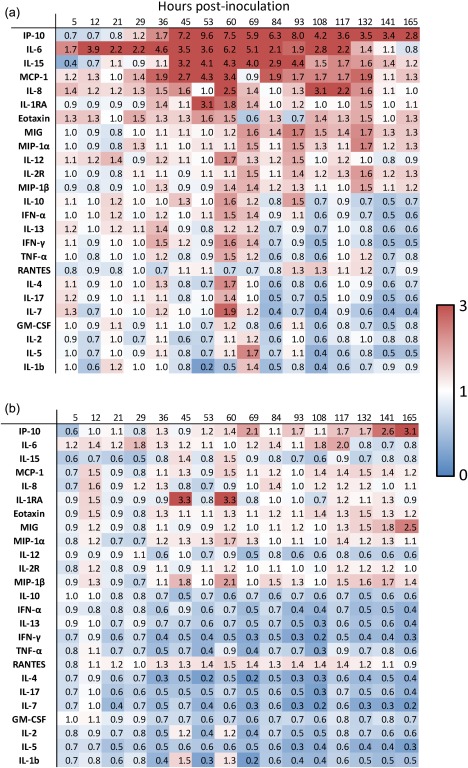
Heatmap showing changes in circulating cytokine levels over time in symptomatic (a) and asymptomatic (b) subjects challenged with influenza A virus. Numbers depicted represent fold change relative to baseline expression levels.
Presymptomatic times (0–45 h post‐inoculation)
There were no significant differences in baseline, pre‐inoculation cytokines between those who would go on to become symptomatic or asymptomatic. In symptomatic individuals, however, some cytokines commonly increased well before the average time of symptom onset (45 h, Fig. 2). The primary cytokines which experienced the earliest spikes in symptomatic individuals are IL‐6, which shows increased circulating levels of as much as 70% by as early as 5 h post‐inoculation, IL‐12 (21 h), MCP‐1 and eotaxin (29 h), IP‐10 (36 h) and IL‐15 (45 h post‐inoculation, Fig. 2).
Symptomatic times (45–91 h post‐inoculation)
Between the time of symptom onset and symptom maximum, spikes in the circulating levels (minimum 50% increase compared to baseline) of IL‐4 and IL‐7 (small, 60 h), IL‐10 (69 h), IFN‐α (69 h) and tumour necrosis factor (TNF)‐α (60 h) were seen. A slightly larger increase is seen in IL‐1RA at 53 h, a threefold increase. Additionally, further evolution is seen in of the elevation of the most active cytokines as they reach their peak values – IP‐10 (peak 53–69 h, an almost 10‐fold increase), and IL‐6 (peak 60 h, sixfold increase), MCP‐1 (peak 53 h at 4.3‐fold) and IL‐15 (peak 60 h at 4.3‐fold increase).
Interestingly, starting at around the time of maximal symptoms and cytokine expression (84–96 h) and extending even later (132–168 h), symptomatic subjects exhibit not only a gradual reduction in the levels of previously elevated cytokines, but also show specific down‐regulation (relative to baseline) of a number of important mediators, including IL‐1β, IL‐13, IL‐17, granulocyte–macrophage colony‐stimulating factor (GM‐CSF), IL‐2, IL‐7 and IL‐4.
Cytokine changes relative to symptoms
Individual cytokine expression levels did not correlate directly with any individual symptom, nor were there any specific cytokines that distinguished ‘upper respiratory’ (runny nose, sinus stuffiness, sneezing, sore throat, earache, cough, shortness of breath) or ‘systemic’ (malaise, myalgias, fever) symptom subgroups. Even the best‐performing individual cytokine (IP‐10) showed only a moderate correlation with overall symptom score (correlation coefficient 0·64). However, peripheral cytokine levels tended to broadly increase prior to the time of symptom onset and peaked just prior to the time of maximal symptoms, and it is possible to derive a model utilizing the combined score of differentially weighted individual cytokine levels which achieves much closer correlation with overall symptom scores (correlation coefficient 0·84, Fig. 3). There were no significant correlations between cytokine levels achieved and d28 influenza HAI titres (data not shown).
Figure 3.
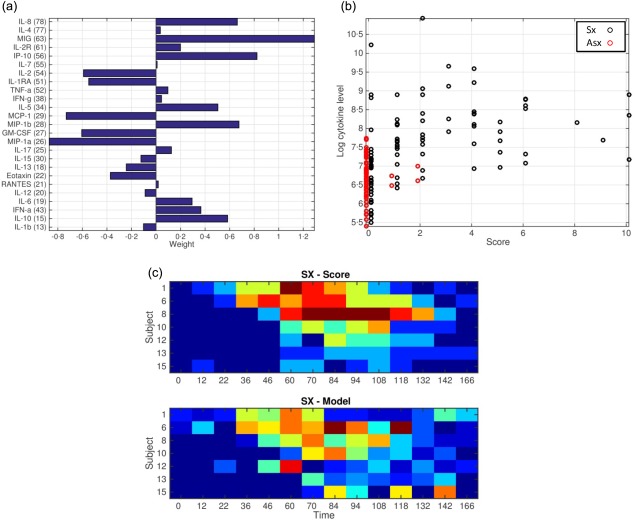
Weighted cytokine model of symptomatic responses. Presented are the relative weight assigned to each cytokine in the model (a), and Spearman's correlations between weighted cytokine levels (y‐axis) and symptom scores of each time‐point in the study (x‐axis) for both symptomatic (black) and asymptomatic (red) subjects (b). (c) A heatmap demonstrating the similarity between actual symptom scores over time for symptomatic subjects (c, top) and predicted symptom scores from the weighted model for the same subjects and time‐points (c, bottom).
Cytokine changes relative to viral load
On average, viral loads peaked at approximately 48 h post‐inoculation, around the mean time of symptom onset but, interestingly, showed no significant correlation at the individual level with the degree of clinical disease (as determined by symptom scoring). However, when divided into the individuals with the highest level of viral shedding and those with the least (top/bottom thirds, as determined by quantitative culture) there were several key differences noted in peripheral cytokine levels (Fig. 4). Those individuals with the highest levels of viral shedding exhibited higher circulating levels of many of the cytokines tested. The largest increases were seen with IL‐6 (threefold higher in high viral shedders), IL‐1RA (threefold higher), IL‐10 (twofold higher) and IP‐10 (threefold higher). The relatively higher levels of peripheral cytokine expression seen in those with the highest viral loads is most prominent around the time of peak viraemia (36–53 h, Figs 1 and 4), further supporting a direct relationship between these variables.
Figure 4.
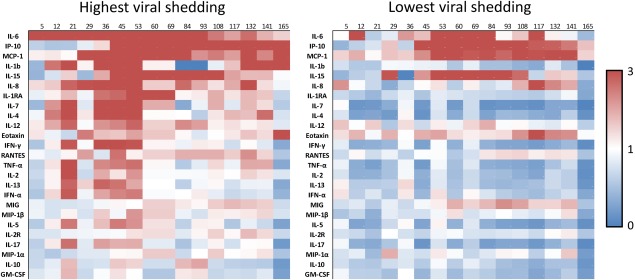
Differential development of circulating cytokine levels over time in the top and bottom third of symptomatic subjects as determined by total viral shedding. Colours depicted represent fold change relative to baseline expression levels.
Comparison to peripheral gene expression
We have published previously on the temporal development of gene expression signatures in circulating white blood cells, which are capable of diagnosing acute respiratory viral infection both at the time of clinical presentation 13, 14 as well as much earlier in the presymptomatic state 13. Specifically, in this cohort of H3N2 challenge patients, a gene expression signature capable of detecting infected subjects accurately was discernible in symptomatic subjects as early as 29 h after inoculation, but absent from those who would remain asymptomatic 13. This gene signature included IFN‐stimulated pathways such as those including radical S‐adenosyl methionine domain‐containing 2 (RSAD2), IFN regulatory factor 7 (IRF7), myxovirus resistance 1 (MX1), 2'‐5'‐oligoadenylate synthetase 3 (OAS3), melanoma differentiation‐associated protein‐5 (MDA‐5), retinoic acid‐inducible I (RIG‐I) and others which are thought to drive both innate and, to a lesser degree, adaptive immune responses to viral infection. In order to examine the hypothesis that increases in some circulating peripheral serum cytokines are driven by production in circulating immune cells (while others are not), we examined differential gene expression levels for those peripheral cytokines which were elevated most significantly in infected subjects. In a subset of individuals (five asymptomatic and seven symptomatic) both cytokine and transcriptomic data were available from the same blood draws, and these were utilized for the analysis depicted in Fig. 5. At the time of symptom onset (45–49 h post‐inoculation) there are already marked increases in the levels of IP‐10, MCP‐1, IL‐15 and IL‐6 (Fig. 2). Interestingly, however, of these cytokines only IP‐10, MCP‐1 (four to fivefold) and to a lesser degree IL‐15 (1.9‐fold) have undergone similar increases in gene expression in PBMCs themselves to that point (Fig. 5). Genes driving production of IL‐6 are not up‐regulated in the peripheral cells themselves. Also, while there are modest changes in the concentration of circulating IFN‐α and IFN‐γ (in the order of 50–60% increases in each), their gene expression remains completely unchanged in the PBMCs (Fig. 5). However, IFN‐inducible genes (such as IFN‐induced protein with tetratricopeptide repeats (IFIT)1, IFIT3, IFI44L and others) are among the most strongly up‐regulated genes in these peripheral cells 13. Later, at the time of maximal symptoms, the levels of some of these peripheral cytokines have decreased substantially (MCP‐1, IL‐6, IL‐8), while the level of gene expression of these cytokines in peripheral cells is only mildly lower. However, at these late times the level of expression of IFN‐inducible (IFI) genes is reaching its highest level, and these IFI genes dominate the influenza‐specific host gene signature at those times. Together, these suggest that while some of the circulating cytokines seen probably originate in circulating peripheral blood leucocytes, others seem more likely to be produced at a distal site (such as locally in the upper respiratory tract).
Figure 5.
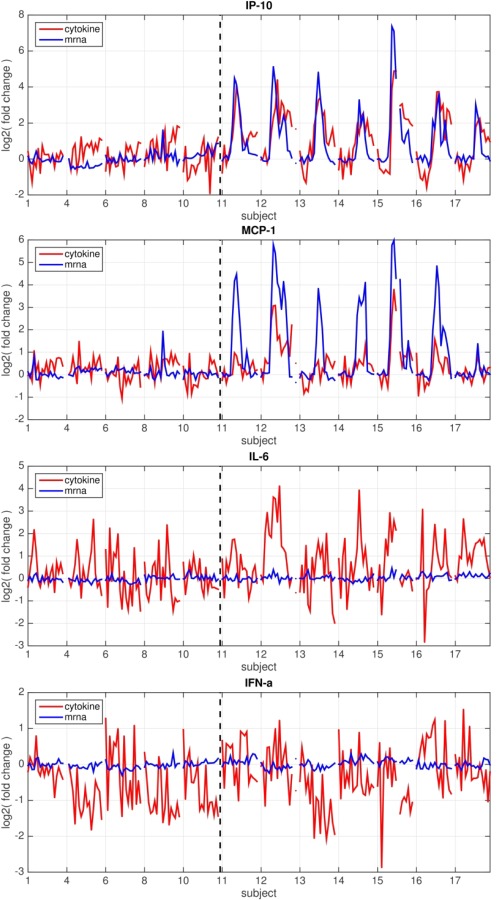
Simultaneous gene expression in circulating peripheral blood mononuclear cells (PBMCs) and serum levels of some cytokines [interferon (IFN) gamma‐induced protein (IP)‐10 and monocyte chemotactic protein (MCP‐1)] suggest that production of these analytes is driven by peripheral cells, while dysregulation of expression of others [interleukin (IL)‐6 and IFN‐α] suggests production at an alternate site. Temporal changes in levels of circulating cytokines (red) or levels of expression of the gene(s) for that cytokine (blue) in circulating PBMCs at the same time‐point. Changes in levels over time (as log2 fold change relative to baseline) are shown for each symptomatic (right of dotted line) and asymptomatic subject (left of dotted line). Only the subset of individuals (five Asx, seven Sx) for whom both cytokine and transcriptomic data from the same blood draws are pictured.
Key cytokine changes in the asymptomatic state
Despite extensive prescreening and identical exposures, eight of the 17 individuals in this study (47%) exhibited no symptoms or viral shedding following inoculation, which is similar to the rate reported in previous challenge studies 11, 12, 19. However, we have demonstrated previously that the peripheral gene expression profile of these individuals indicates that there is still a significant host response in these asymptomatic individuals 2. The asymptomatic but exposed state is not passive, but involves a significant genomic response in peripheral white blood cells – different from that seen in symptomatic subjects – yet these individuals do not exhibit clinical signs of influenza infection. Concordantly, in the current work we also see temporal changes in their peripheral cytokine expression patterns which are different from those seen in symptomatic subjects. There is some minor and variable up‐regulation of some cytokines starting immediately post‐inoculation, and this is seen most prominently in the same cytokines which dominate the symptomatic response, although at significantly lower levels (Fig. 2). However, the asymptomatic cytokine response is dominated by a significant early down‐regulation of many of the cytokines tested. There was a generalized down‐regulation of IL‐7, IL‐5, IFN‐γ (all essentially immediately following inoculation) and, to a lesser degree, IL‐17, IL‐15, IL‐4 and MIP‐1a. While there is also down‐regulation of most of these cytokines in symptomatic subjects, it does not occur until late (84–96 h) in the process when symptoms are high and viral load is decreasing. In symptomatic subjects this time corresponds to a natural correction of the immune response towards regulation and a return to homeostatic levels; however, in asymptomatic subjects this down‐regulation occurs almost immediately and persists throughout the study period. Interestingly, despite a lack of detectable viral shedding three asymptomatic individuals seroconverted to challenge virus by day 28. No significant differences were noted in the cytokine profiles of these three relative to the other asymptomatic subjects.
Discussion
We have utilized a human viral challenge study with influenza A (H3N2) to define the host‐based peripheral blood cytokine expression patterns characteristic of the temporal response to influenza infection. The results provide clear evidence that unique, biologically relevant peripheral blood cytokine expression patterns are characteristic of symptomatic influenza in humans. For the first time we have further undertaken to explore the development and evolution of such a diverse cytokine panel over time throughout the course of clinical disease. The results highlight the profound immune activation which occurs in this disease state, and provide key insights into the mechanisms that probably drive the symptomatic response in human hosts.
In symptomatic individuals, the major cytokine which undergoes the earliest increase is IL‐6, which shows increased levels as early as 5–12 h post‐inoculation. The early increase in IL‐6 is consistent with its role as an acute‐phase reactant and known mediator of the febrile response in a number of disease states, including severe influenza infection 1, 5, 7, although the increased levels here precede symptom onset by as much as 2 days. At approximately 29–36 h we begin to see increased circulating levels of chemoattractants IP‐10 and MCP‐1, the timing of which also suggests a possible role for these cytokines in driving the initiation of some early pathology. At slightly later times (45–60 h), corresponding to the time of average symptom onset but still well before symptom maximum, a number of other cytokines begin to be expressed significantly in symptomatic‐infected individuals. These include T helper type 1 (Th1) cytokines IFN‐γ, IL‐15 and the chemoattractant IL‐8, as increases in circulating levels of these early mediators crescendo and become quantitatively more robust. Overall, the immunological pathways of leucocyte recruitment, Toll‐like receptor (TLR)‐signalling, innate anti‐viral immunity and fever production are all over‐represented in symptomatic individuals very early in disease, but are also dynamic and evolve continuously over time. We see elevations in symptomatic subjects of many of the same cytokines which have been reported to be closely correlated with severe disease in hospitalized pH1N1, H5N1 and H7N9 infections 4, 5, 20, 21. Influenza infection induces activation of chemoattractants IP‐10, MCP‐1, MIP‐1β, MIG and IL‐8, which are driven by adaptive and innate responses. Unchecked, the induction of certain proinflammatory cytokines such as TNF‐α and chemoattractants IP‐10, MIP‐1β, MCP‐1 and MIG is known to contribute to the pathogenesis of severe H5N1 and H3N2 influenza infection 7, 8, 22. However, the individuals in our challenge model exhibit fairly mild‐to‐moderate symptoms overall, suggesting that determination of severe symptomatology is due to more than simple activation of these common inflammatory response pathways.
Interestingly, despite the fairly rapid and profound up‐regulation of IFN‐response genes in the circulating cells, there are only minor increases (40–50%) in circulating levels of measured interferons, almost none of which appear to be expressed by peripheral cells, and these do not occur for several days following inoculation (Figs 3 and 5). This suggests that there is relatively greater physiological downstream effect of quantitatively smaller increases in some cytokines. Also, the high circulating levels of some cytokines such as IL‐6 in the absence of significant up‐regulation of the genes driving IL‐6 cytokine production in circulating PBMCs (Fig. 5) suggests that while peripheral cells may be contributing to the levels of some cytokines, others are probably being produced locally at the site of inoculation and then released into the periphery 11.
Contrary to individuals who will go on to become symptomatic, asymptomatic individuals exhibit immediate and persistent down‐regulation of many circulating cytokines in the immediate early phase following infection, while simultaneously allowing a much more muted increase in the cytokines which drive the symptomatic response. In effect, our results demonstrate that the asymptomatic (but still virally inoculated) state is not passive, and suggest that perhaps the immune response in those individuals represents a focused, limited, but still effective early response, whereas the response in symptomatic individuals is much more robust, but may also therefore lead incidentally to the development of clinical disease. Unfortunately, study of the peripheral cytokine response alone does not identify the driving force behind this muted (but still successful), quantitatively appropriate response in asymptomatic individuals. Individuals were prescreened for vaccine history as well as anti‐HA and neutralizing antibody titres to the challenge virus as a condition for inclusion, but there are data suggesting non‐humoral pre‐existing immunity (primarily T cell‐mediated and directed towards conserved, immunodominant epitopes) also plays a role in this observed divergence 15, 23. It seems likely that complex interactions at the site of inoculation, under the control of pre‐existing, targeted immune cell types such as these, aid in determining which pathway exposed individuals will follow. Also, our data suggest that the determination of which inflammatory pathway an individual will follow is probably determined at very early, even presymptomatic times, highlighting the need for early diagnosis and the potential for early host‐targeted intervention 24, 25, 26.
The differences between symptomatic and asymptomatic cytokine responses are profound, and a model that involves weighting of individual cytokines (Fig. 3) permits distinction between symptomatic and asymptomatic individuals not only at the time of maximal symptoms (where patients might present to a clinician) but at much earlier times when the symptomatic cytokine response is already profound but clinical disease is only just beginning. Whether such a lag time might be beneficial for predicting future development of severe disease is unclear, for while many of same cytokines known to be associated with severe clinical disease are found in our model 4, 5, 8, our patients never progress beyond moderate symptoms (Fig. 1) 13.
Despite the benefits of using a human challenge model, including controlled variables and the availability of dense temporal sampling, such models convey certain limitations. The mechanism of disease initiation through direct nasal inoculation with high levels of virus is contrived, rather than natural, and it is unknown how this may affect host responses. Also, the degree of clinical disease seen is often not severe and tends to be less than those symptoms which typically lead patients to seek clinical care or hospitalization, which can limit broad applicability of the findings. The variability of absolute cytokine levels between individuals coupled with the relatively small number of subjects in the study limit the statistical significance of some findings, which could be alleviated by future studies of larger cohorts. Although the unique types of changes demonstrated herein have not been seen with previous ‘sham’ viral challenges in either our hands or others' 27, without a ‘sham’‐inoculated control the down‐regulation of cytokines in asymptomatic subjects cannot be shown definitively to represent a muted host anti‐viral response rather than the general effects of inoculation and study procedures. Furthermore, this work also focuses upon those conclusions which can be made from analysis of peripherally circulating cytokines during the presymptomatic and clinical phases of illness, which represent only a subset of the many‐faceted totality of the human immune response.
In conclusion, the host cytokine response to experimental influenza challenge seems to follow one of two divergent paths. In individuals who will go on to become symptomatic the peripheral cytokine response is robust, detectable well prior to the onset of symptoms and manifested through pathways seen typically in severe clinical disease. In those who will remain asymptomatic, however, the host response is characterized by immediate control with rapid and focused down‐regulation of inflammatory pathways. These differences highlight the complexity of the host response to influenza challenge and suggest that directing the body's early immune response towards appropriate control of the relevant inflammatory pathways may be central to improving clinical outcomes.
Author contributions
M. T. M., E. L. T., G. S. G. and C. W. W. wrote the manuscript. R. L. W., A. G., G. S. G., M. T. M., and C. W. W. designed and ran the viral challenge. R. H. and M. T. M. performed data analysis. J. W., B. N., T. L. and L. H. designed the study and performed the experiments.
Disclosure
The authors report no disclosures relating to this work.
Supporting information
Additional Supporting information may be found in the online version of this article at the publisher's web‐site:
Fig. S1. Representative composite cytokine curve creation.
Acknowledgements
Cytokine panels were performed through the Duke Human Vaccine Institute (Durham, NC, USA) under the direction of Greg Sempowski. Sample handling was led by Heather Lynch PhD and Paul Morrow. Microarrays were performed through Expression Analysis® (Raleigh, NC, USA). This work was supported by funding from the Veteran's Affairs Medical Center, number 1IK2CX000611 (MTM) and the Defense Advanced Research Projects Agency (DARPA), number lN66001‐07‐C‐0092 (GSG).
References
- 1. Lee N, Wong CK, Chan PK et al Cytokine response patterns in severe pandemic 2009 H1N1 and seasonal influenza among hospitalized adults. PLOS ONE 2011; 6:e26050. [DOI] [PMC free article] [PubMed] [Google Scholar]
- 2. Huang Y, Zaas AK, Rao A et al Temporal dynamics of host molecular responses differentiate symptomatic and asymptomatic influenza A infection. PLOS Genet 2011; 7:e1002234. [DOI] [PMC free article] [PubMed] [Google Scholar]
- 3. Clark RSB, Carcillo JA, eds. Molecular biology of acute lung injury. Boston/Dordrecht/London: Kluwer Academic Publishers; 2001. [Google Scholar]
- 4. Davey RT Jr, Lynfield R, Dwyer DE et al The association between serum biomarkers and disease outcome in influenza A (H1N1)pdm09 virus infection: results of two international observational cohort studies. PLOS ONE 2013; 8:e57121. [DOI] [PMC free article] [PubMed] [Google Scholar]
- 5. Chi Y, Zhu Y, Wen T et al Cytokine and chemokine levels in patients infected with the novel avian influenza A (H7N9) virus in China. J Infect Dis 2013; 208:1962–7. [DOI] [PubMed] [Google Scholar]
- 6. Wang Z, Zhang A, Wan Y et al Early hypercytokinemia is associated with interferon‐induced transmembrane protein‐3 dysfunction and predictive of fatal H7N9 infection. Proc Natl Acad Sci USA 2014; 111:769–74. [DOI] [PMC free article] [PubMed] [Google Scholar]
- 7. Peiris JS, Yu WC, Leung CW et al Re‐emergence of fatal human influenza A subtype H5N1 disease. Lancet 2004; 363:617–9. [DOI] [PMC free article] [PubMed] [Google Scholar]
- 8. Chan MC, Cheung CY, Chui WH et al Proinflammatory cytokine responses induced by influenza A (H5N1) viruses in primary human alveolar and bronchial epithelial cells. Respir Res 2005; 6:135. [DOI] [PMC free article] [PubMed] [Google Scholar]
- 9. Walsh KB, Teijaro JR, Rosen H, Oldstone MB. Quelling the storm: utilization of sphingosine‐1‐phosphate receptor signaling to ameliorate influenza virus‐induced cytokine storm. Immunol Res 2011; 51:15–25. [DOI] [PubMed] [Google Scholar]
- 10. Bradley‐Stewart A, Jolly L, Adamson W et al Cytokine responses in patients with mild or severe influenza A(H1N1)pdm09. J Clin Virol 2013; 58:100–7. [DOI] [PubMed] [Google Scholar]
- 11. Hayden FG, Fritz R, Lobo MC, Alvord W, Strober W, Straus SE. Local and systemic cytokine responses during experimental human influenza A virus infection. Relation to symptom formation and host defense. J Clin Invest 1998; 101:643–9. [DOI] [PMC free article] [PubMed] [Google Scholar]
- 12. Memoli MJ, Czajkowski L, Reed S et al Validation of the wild‐type influenza A human challenge model H1N1pdMIST: an A(H1N1)pdm09 dose‐finding investigational new drug study. Clin Infect Dis 2015; 60:693–702. [DOI] [PMC free article] [PubMed] [Google Scholar]
- 13. Woods CW, McClain MT, Chen M et al A host transcriptional signature for presymptomatic detection of infection in humans exposed to influenza H1N1 or H3N2. PLOS ONE 2013; 8:e52198 [DOI] [PMC free article] [PubMed] [Google Scholar]
- 14. Zaas AK, Chen M, Varkey J et al Gene expression signatures diagnose influenza and other symptomatic respiratory viral infections in humans. Cell Host Microbe 2009; 6:207–17. [DOI] [PMC free article] [PubMed] [Google Scholar]
- 15. Wilkinson TM, Li CK, Chui CS et al Preexisting influenza‐specific CD4+ T cells correlate with disease protection against influenza challenge in humans. Nat Med 2012; 18:274–80. [DOI] [PubMed] [Google Scholar]
- 16. Jackson GG, Dowling HF, Spiesman IG, Boand AV. Transmission of the common cold to volunteers under controlled conditions. I. The common cold as a clinical entity. AMA Arch Intern Med 1958; 101:267–78. [DOI] [PubMed] [Google Scholar]
- 17. Leland DS, French MLV. Virus isolation and identification In: Lennette EH, Halonen P, Murphy FA, eds. Laboratory diagnosis of infectious diseases: principles and practices. New York: Springer‐Verlag; 1988. pp 39–59. [Google Scholar]
- 18. Yuan XHR, Tsalik EL, Langley R, Carin L. Non‐Gaussian discriminative factor models via the max‐margin rank‐likelihood. Proceedings of the 32nd International Conference on Machine Learning 2015; 15:1254–63. [Google Scholar]
- 19. Hayden FG, Treanor JJ, Fritz RS et al Use of the oral neuraminidase inhibitor oseltamivir in experimental human influenza: randomized controlled trials for prevention and treatment. JAMA 1999; 282:1240–6. [DOI] [PubMed] [Google Scholar]
- 20. Lee N, Chan PK, Wong CK et al Viral clearance and inflammatory response patterns in adults hospitalized for pandemic 2009 influenza A (H1N1) virus pneumonia. Antivir Ther 2011; 16:237–47. [DOI] [PubMed] [Google Scholar]
- 21. de Jong MD, Simmons CP, Thanh TT et al Fatal outcome of human influenza A (H5N1) is associated with high viral load and hypercytokinemia. Nat Med 2006; 12:1203–7. [DOI] [PMC free article] [PubMed] [Google Scholar]
- 22. Monteerarat Y, Sakabe S, Ngamurulert S et al Induction of TNF‐alpha in human macrophages by avian and human influenza viruses. Arch Virol 2010; 155:1273–9. [DOI] [PubMed] [Google Scholar]
- 23. Sridhar S, Begom S, Bermingham A et al Cellular immune correlates of protection against symptomatic pandemic influenza. Nat Med 2013; 19:1305–12. [DOI] [PubMed] [Google Scholar]
- 24. Oldstone MB, Rosen H. Cytokine storm plays a direct role in the morbidity and mortality from influenza virus infection and is chemically treatable with a single sphingosine‐1‐phosphate agonist molecule. Curr Top Microbiol Immunol 2014; 378:129–47. [DOI] [PMC free article] [PubMed] [Google Scholar]
- 25. Shirey KA, Lai W, Scott AJ et al The TLR4 antagonist Eritoran protects mice from lethal influenza infection. Nature 2013; 497:498–502. [DOI] [PMC free article] [PubMed] [Google Scholar]
- 26. Lee SM, Yen HL. Targeting the host or the virus: current and novel concepts for antiviral approaches against influenza virus infection. Antiviral Res 2012; 96:391–404. [DOI] [PMC free article] [PubMed] [Google Scholar]
- 27. Proud D, Turner RB, Winther B et al Gene expression profiles during in vivo human rhinovirus infection: insights into the host response. Am J Respir Crit Care Med 2008; 178:962–8. [DOI] [PubMed] [Google Scholar]
Associated Data
This section collects any data citations, data availability statements, or supplementary materials included in this article.
Supplementary Materials
Additional Supporting information may be found in the online version of this article at the publisher's web‐site:
Fig. S1. Representative composite cytokine curve creation.