

Significance
Forecasting reservoirs of zoonotic disease is a pressing public health priority. We apply machine learning to datasets describing the biological, ecological, and life history traits of rodents, which collectively carry a disproportionate number of zoonotic pathogens. We identify particular rodent species predicted to be novel zoonotic reservoirs and geographic regions from which new emerging pathogens are most likely to arise. We also describe trait profiles—complexes of biological features—that distinguish reservoirs from nonreservoirs. Generally, the most permissive rodent reservoirs display a fast-paced life history strategy, maximizing near-term fitness by having many altricial young that begin reproduction early and reproduce frequently. These findings may constitute an important lead in guiding the search for novel disease reservoirs in the wild.
Keywords: machine learning, disease forecasting, prediction, pace-of-life hypothesis, generalized boosted regression trees
Abstract
The increasing frequency of zoonotic disease events underscores a need to develop forecasting tools toward a more preemptive approach to outbreak investigation. We apply machine learning to data describing the traits and zoonotic pathogen diversity of the most speciose group of mammals, the rodents, which also comprise a disproportionate number of zoonotic disease reservoirs. Our models predict reservoir status in this group with over 90% accuracy, identifying species with high probabilities of harboring undiscovered zoonotic pathogens based on trait profiles that may serve as rules of thumb to distinguish reservoirs from nonreservoir species. Key predictors of zoonotic reservoirs include biogeographical properties, such as range size, as well as intrinsic host traits associated with lifetime reproductive output. Predicted hotspots of novel rodent reservoir diversity occur in the Middle East and Central Asia and the Midwestern United States.
Infectious agents transmitted from animals to humans account for most outbreaks of novel pathogens worldwide (1–3). With over 1 billion cases of human illness attributable to zoonotic disease each year, identifying wild reservoirs of zoonotic pathogens is a perennial public health priority (4). Until now, investigations of disease outbreaks have mostly been reactive, with surveillance efforts targeting a broad host range (5), but because human activities precipitating these events continue to accelerate (4, 6), a more proactive approach is necessary (7, 8). Identifying which wildlife species are most likely to serve as reservoirs of future zoonotic diseases and in which regions new outbreaks are most likely to occur are necessary steps toward a preemptive approach to minimizing zoonotic disease risk in humans. To this end, trait profiles inferred from large datasets that distinguish reservoirs from nonreservoir species can play a major role in guiding the search for novel disease reservoirs in the wild. Identifying these distinguishing, intrinsic features of zoonotic reservoirs also has the potential to generate testable hypotheses that can explain why some host species are more permissive to zoonotic infections.
To accomplish these goals, we applied generalized boosted regressions (9, 10), a type of machine learning that builds ensembles of classification/regression trees to identify variables that are most important for prediction—in our case, predicting zoonotic reservoir status and hyperreservoir status (species known to carry two or more zoonotic infections). These methods and similar methods have particular use for comparative ecological studies because they accommodate multiple data types as covariates, nonrandom patterns of data missingness, and hidden, nonlinear interactions. The explanatory power of decision tree methods is unaffected by variations in data coverage that may arise because of sampling bias or when species share a particular trait because of shared evolutionary history (11, 12). We examined intrinsic traits of host species, which are inherently less susceptible to sampling biases common in large-scale epidemiological analyses—for example, important differences in gross domestic product, research productivity, or diagnostic capacity that are certain to influence detection of zoonotic disease reservoirs among countries are unlikely to influence biological or life history characteristics of the wild species found in these countries. Machine learning methods generally do not assume an underlying model, a priori designation of interacting variables, or independence among data points, thereby precluding the need for phylogenetic corrections (11, 13). Such model-free approaches allow the data to speak for themselves and enable statistical learning algorithms to achieve superior predictive accuracy (10) and identify prominent patterns in the data that spark novel hypotheses.
Results and Discussion
Of 2277 extant rodent species, 217 species are reservoirs harboring 66 zoonoses caused by viruses, bacteria, fungi, helminths, and protozoa (Figs. 1 and 2A and Dataset S1). Of these, 79 species were hyperreservoirs, carrying between 2 and 11 zoonoses (Fig. 3A). We examined 86 predictor variables describing intrinsic features of rodent life history, ecology, behavior, physiology, and biogeography (14) (listed and defined in Dataset S2). From these data, our models predicted zoonotic reservoir status with ∼90% accuracy (Dataset S3) and identified over 50 potentially new zoonotic reservoir species in the 90th percentile of model predictions (Fig. 2B and Dataset S4). We also identified over 150 new hyperreservoirs (Fig. 3B and Dataset S4) predicted to harbor additional zoonoses beyond the single disease that they are currently confirmed to carry (Fig. 3B). A model trained on the number of zoonoses per rodent species (pseudo-R2 = 0.21) (Dataset S3, column 1) produced a trait profile and species predictions similar to the model predicting the binary response of reservoir status (Fig. 4 and Datasets S3 and S4).
Fig. 1.

A bubble plot showing the types of pathogens and parasites (top axis) recorded to infect rodent species in the wild. Of the rodents that harbor one zoonosis (row 1; 138 species), the majority of the etiologic agents are viruses (n = 57), and the minority are fungi (n = 4). However, among reservoirs carrying numerous zoonoses, the distribution of viral, bacterial, helminth, and protozoan etiologic agents is more even. Fungal diseases are underrepresented overall.
Fig. 2.
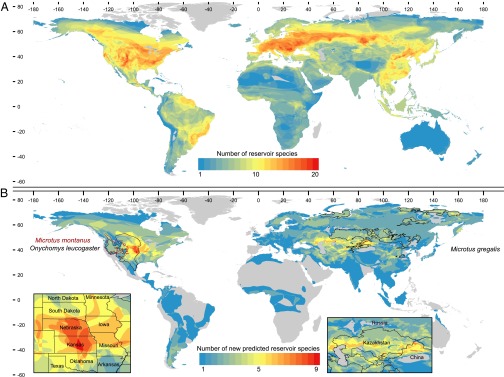
A map showing global hotspots of (A) rodent reservoir diversity and (B) novel reservoir species predicted by our models to be in the 90th percentile probability of harboring one or more undiscovered zoonoses (58 species). Warmer colors are the overlapping geographical ranges of multiple species, and these areas are magnified in Insets to show that hotspots occur in the Midwestern region of the United States (Kansas and Nebraska) and across the Middle East and Central Asia (Kazakhstan and northern China). B also outlines (black and maroon) the geographic ranges of three species with the highest probability (∼70%) of being undiscovered zoonotic reservoirs.
Fig. 3.
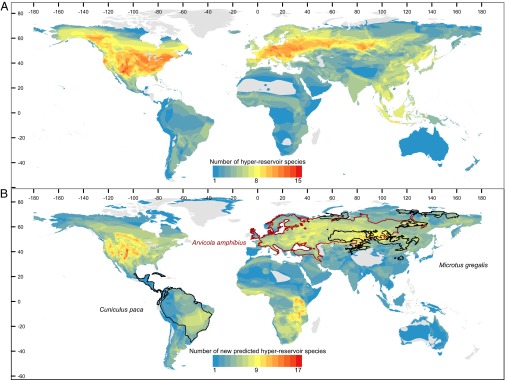
A map showing global hotspots of (A) current rodent hyperreservoir diversity and (B) 159 new hyperreservoirs predicted to be in the 90th percentile probability of harboring additional zoonoses beyond the single disease that they are currently confirmed to carry. B also outlines (black and maroon) the geographic ranges of three species with the highest probabilities (62–69%) of being zoonotic hyperreservoirs.
Fig. 4.
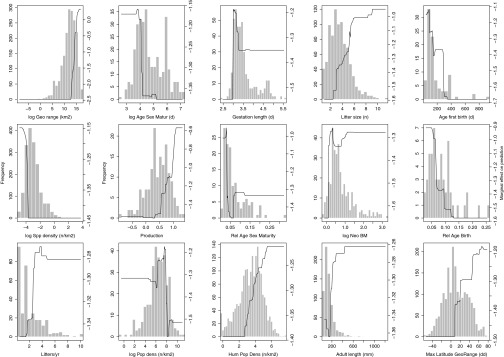
Marginal plots of the top 15 predictor variables from a generalized boosted regression analysis on the number of zoonoses carried by rodent reservoirs showing the marginal effect of each trait (shown in order of importance) on the probability of harboring one or more zoonotic pathogens. In general, trait values associated with fast life history strategies have the strongest influence on whether the model correctly predicts the number of zoonoses carried by reservoirs. In addition to traits compiled from the PanTHERIA database (14), three derived variables were important: relative sexual maturity age [age at sexual maturity/maximum longevity (days)], relative age at first birth [age at first birth/maximum longevity (days)], and production (35) (mean mass of offspring produced per year normalized by adult body size). The definitions for all variables can be found in Dataset S1.
From previous studies in wildlife, it is clear that infection patterns can be the result of complex relationships between hosts and parasites that depend on the lifecycle and transmission mode of the parasite as well as the life history strategies, tradeoffs, and ecological context of host species (15–17). By simultaneously considering all rodent species and the zoonotic infectious agents that they are known to carry, our models identified trait profiles suggesting that rodent reservoirs are distinguished from other rodent species by a fast-paced life history strategy (Fig. 4, Fig. S1, and Dataset S3). Rodent reservoirs reach sexual maturity and begin producing offspring at higher rates earlier in life compared with nonreservoirs. Neonates are born in mid- to large-sized litters after relatively short gestation periods. (Short gestation periods and frequent litters may point to fast postnatal growth rates as a hallmark of reservoir species, but postnatal growth rate was a relatively unimportant predictor for models predicting reservoir status and zoonosis counts. Postnatal growth rate was an important predictor of hyperreservoir status.) Taken together, this profile suggests that, in general, rodent species with the highest likelihood of carrying many zoonotic diseases are those able to maximize near-term fitness by having many altricial young that begin reproduction early and reproduce frequently. Interestingly, these functional trait covariates are far more important in predicting reservoir status and number of zoonoses than taxonomic labels, despite the fact that such traits are fairly well-phylogenetically conserved. It is possible, therefore, that rodent reservoirs may be particularly well-suited to balancing the fitness consequences of parasitism relative to closely related nonreservoir species. For example, species exhibiting the classic fast-paced life history strategy may run a higher risk of acquiring acute, lethal infections in the short term but may also be adept at outrunning this risk by producing many offspring more quickly, despite the costs of infection, perhaps by using less costly nonspecific immune defense strategies (18) or through unique mechanisms of disease tolerance that do not impair reproductive output (19).
Zoonotic diseases are expected to pose a greater risk in regions where humans are experiencing increasing contact with wildlife (4, 20–22), especially in biodiverse developing nations in the tropics (2). Our results link zoonotic reservoirs to large geographic range areas with relatively low species density and human population densities of at least 50 people/km2 (Fig. 4). We report current hotspots of rodent reservoir diversity occurring in North America, the Atlantic coast of South America, Europe, Russia, and parts of Central and East Asia, with a majority of both reservoir and hyperreservoir species occurring in upper latitudes (maximum latitude of species’ geographic ranges >40° N) (Figs. 2A, 3A, and 4). Using the 90th percentile as a cutoff, we also identify 58 species predicted to be novel reservoirs and 159 species predicted to be novel hyperreservoirs (Dataset S4). Predicted hotspots of novel rodent reservoirs occur broadly, spanning arctic, temperate, tropical, and desert biomes, regions that exhibit a wide range of mammal species richness, and middle- to high-income economies (23–25), with hotspots occurring in the Middle East and Central Asia (China and Kazakhstan) and the Midwestern United States (Kansas, Nebraska). Interestingly, many of the rodent reservoir hotspots are located in regions where human emerging infectious disease events (both zoonotic and nonzoonotic) are the most concentrated (∼40° N) (supplementary figure 1 in ref. 2) and areas where we find higher diversity of rodent-borne zoonoses and more human outbreaks of rodent-borne diseases at the country scale (Fig. S2). Moreover, the partial plot for this covariate (Fig. 4) shows that zoonotic reservoirs tend to have disproportionately low mammalian species densities within their geographic ranges compared with the majority of rodent species [log species (n per kilometer2)] (Fig. 4), although we note that these results should be considered in light of decelerating species–area curves for species with smaller geographic ranges. Collectively, these results may evidence a larger-scale pattern in which synanthropic wildlife species are more likely sources of zoonotic disease in humans (21, 22). The majority of current and predicted hyperreservoir species occurs in ecoregions that experience an appreciable degree of seasonality, which concurs with findings from other vertebrate systems that physiological tradeoffs between immunity and reproductive output in temporally dynamic environments may underlie the biogeographical and life history patterns that we find in the most permissive rodent reservoirs (26, 27).
Clearly, the process of disease emergence from wild reservoirs into human hosts is complex, depending on many interacting factors (4, 8, 20–22, 28–33). Our methods use a trait-based approach focusing on intrinsic biological traits together with ecological and geographical traits shared among hosts that currently carry zoonotic disease to capture a characteristic profile for zoonotic reservoirs. The predictions generated by our models contribute an important baseline for designing surveillance and field studies for particular regions and species and bringing into focus testable hypotheses about what enables some species to maintain and transmit zoonotic infections to humans (34). Our study shows that it is now possible to predict with a remarkable degree of accuracy the wild species that carry zoonotic infections. We also show that machine learning approaches can be a valuable tool for generating concrete rules of thumb to characterize new, undiscovered reservoirs in the future and a valuable way to generate hypotheses about intrinsic features that may be playing a key role in promoting hosts’ permissiveness to zoonotic infections. Moving forward, sorting out which reservoirs pose the greatest risk to humans, identifying the mechanisms leading to observed reservoir hotspots, and understanding the biological underpinnings of reservoir trait profiles will require empirical ground-truthing that depends on detailed field work, experimentation, and continued surveillance by an interdisciplinary scientific community.
Methods
Data.
Rodent trait data were obtained from PanTHERIA (14), a species-level database of life history, ecological, and geographical traits of the world’s mammals. We calculated four additional traits: postnatal growth rate (weaning body mass/neonatal body mass), relative age to sexual maturity (sexual maturity age/maximum longevity), relative age at first birth (age at first birth/maximum longevity), and production [mean mass of offspring produced per year normalized by adult body size (35)]. We also included families as additional binary variables to explore the likelihood of zoonotic reservoirs arising from particular rodent families. Using terrestrial mammal range maps from the International Union for the Conservation of Nature (IUCN) (36), we calculated species density (the richness of mammal species found within a species’ geographic range divided by the geographic range area in units of n per kilometer2). We collected data on reservoir status and the number of unique zoonoses carried by each rodent species. In contrast to other ecological definitions of reservoir (37), we apply the term more generally to encompass wild species capable of carrying infections transmissible to humans. Predicted reservoir species are undiscovered potential sources of zoonotic infections that are known to be transmissible to humans. These data were collected from the primary literature guided by the Global Infectious Disease and Epidemiology Network [GIDEON; a real-time database geared toward medical practitioners to aid in the diagnosis and treatment of human infectious disease (38)], the Web of Science (WOS) and PubMed scientific indexing services, and web search. We refer to any species confirmed by peer-reviewed primary literature using standard diagnostic procedures to carry a zoonotic infectious agent in either wild or captive settings but not as a result of inoculation. Our dataset includes 429 unique rodent–pathogen combinations comprised of 66 zoonoses and 217 reservoir species. Although there are more than 217 rodent species that have been found with zoonotic infections, we have restricted our analyses to a conservative subset of host species and diseases recognized by GIDEON as having prominent zoonotic relevance for human populations. Rodent species names were standardized using the work by Wilson and Reeder (39), and a translation table connecting PanTHERIA taxonomy to current IUCN taxonomy can be found in Dataset S5. Data for these analyses are available from the Dryad Digital Repository, datadryad.org (10.5061/dryad.7fh4q).
Analyses.
We derived three response variables from our data. To predict probable rodent reservoirs of zoonotic disease, each rodent species was assigned a binary code according to its current reservoir status. To capture the trait profile of rodent reservoirs, we quantified the number of zoonoses for which each species was confirmed to be a reservoir. Also, we assigned binary scores to further distinguish the traits of hyperreservoirs (species carrying two or more zoonotic parasites) from reservoirs carrying only a single zoonosis (results of these analyses are summarized in Dataset S3). For each of these three response variables, we used boosted regression trees (9, 40) with either Bernoulli- or Poisson-distributed error for binary or count responses, respectively. Boosted regression trees generate a series of recursive binary splits for randomly sampled predictor variables. This process is repeated several thousand times to create an ensemble regression or classification model. We built 800–10,000 trees for each analysis and present the most important variables for predicting the response. Datasets were partitioned into training (80% of all 2,277 species) and test (the remaining 20%) sets before analysis. We applied 10-fold cross-validation during model building to prevent overfitting and permutation procedures to generate relative importance scores for each predictor variable (Dataset S3 also summarizes tuning parameters, performance metrics, and complete trait profiles). In these analyses, unknown reservoirs (2,061 species) were designated nonreservoirs. In the absence of repeated experimental inoculations, a large number of individuals of each species must be sampled before consensus can be reached that a given species is unable to harbor infection. Thus, we adopted a more conservative designation to develop predictive models, with baseline classification performance that can only improve with ongoing discoveries of novel zoonotic reservoirs.
To control for the potential effects of sampling bias on our results, we tallied the number of primary literature citations in the WOS for each rodent species in our dataset as a proxy for sampling intensity. Because WOS hits increased monotonically with the number of zoonoses that they harbored, we tested whether the trait profiles that we identified were predictive of “studiedness” rather than zoonotic reservoir status using the same boosted regression tree models with WOS counts as the response variable (Dataset S3). We found that the best-fitting model poorly predicted studiedness (pseudo-R2 = 0.07), even when data were restricted to consider only species with 10 or more citations (n = 503, pseudo-R2 = 0.17). Thus, although sampling bias is clearly in evidence, regression analyses indicate that the trait patterns of well-studied rodents and those of rodent reservoirs are not coincident. As a follow-up, we included WOS counts as an independent variable and found that, although it had the highest relative importance for correctly predicting the number of zoonoses carried by rodent species, the profile of intrinsic traits was consistent with a fast-paced life history strategy—rodent reservoirs tend to reach sexual maturity early and produce large litters more times per year, and the mean mass of offspring produced per year [normalized by adult body size; production (35)] is also greater (Fig. S3). Analyses were performed using the gbm package (40) in R (41).
Maps.
To identify reservoir hotspots, we mapped the geographic ranges of all known reservoir and hyperreservoir species as well as the species in the 90th percentile of model predictions for reservoir and hyperreservoir status (Dataset S4). All geographic ranges were obtained from the IUCN database of terrestrial mammals (36) and compiled in a geographical information system (ArcGIS) (42). We also compiled the number of unique zoonoses and the number of rodent-borne human infectious disease outbreaks per country since 1990 from the GIDEON database (38) in ArcGIS (42).
Supplementary Material
Acknowledgments
The authors thank Andrew M. Kramer, Tomlin Pulliam, and Shan Huang for computational assistance, and the Computational Ecology and Epidemiology Study Group at the University of Georgia for feedback. We also thank Richard S. Ostfeld, John L. Gittleman, and Rodney L. Honeycutt for contributed expertise. B.A.H. was supported by the NIH National Research Service Award Postdoctoral Research Fellowship.
Footnotes
The authors declare no conflict of interest.
This article is a PNAS Direct Submission.
Data deposition: The data reported in this paper have been deposited in the Dryad Digital Repository, datadryad.org (DOI no. 10.5061/dryad.7fh4q).
This article contains supporting information online at www.pnas.org/lookup/suppl/doi:10.1073/pnas.1501598112/-/DCSupplemental.
References
- 1.Taylor LH, Latham SM, Woolhouse MEJ. Risk factors for human disease emergence. Philos Trans R Soc Lond B Biol Sci. 2001;356(1411):983–989. doi: 10.1098/rstb.2001.0888. [DOI] [PMC free article] [PubMed] [Google Scholar]
- 2.Jones KE, et al. Global trends in emerging infectious diseases. Nature. 2008;451(7181):990–993. doi: 10.1038/nature06536. [DOI] [PMC free article] [PubMed] [Google Scholar]
- 3.Lloyd-Smith JO, et al. Epidemic dynamics at the human-animal interface. Science. 2009;326(5958):1362–1367. doi: 10.1126/science.1177345. [DOI] [PMC free article] [PubMed] [Google Scholar]
- 4.Karesh WB, et al. Ecology of zoonoses: Natural and unnatural histories. Lancet. 2012;380(9857):1936–1945. doi: 10.1016/S0140-6736(12)61678-X. [DOI] [PMC free article] [PubMed] [Google Scholar]
- 5.Woolhouse MEJ, Gowtage-Sequeria S. Host range and emerging and reemerging pathogens. Emerg Infect Dis. 2005;11(12):1842–1847. doi: 10.3201/eid1112.050997. [DOI] [PMC free article] [PubMed] [Google Scholar]
- 6.Woolhouse M, Gaunt E. Ecological origins of novel human pathogens. Crit Rev Microbiol. 2007;33(4):231–242. doi: 10.1080/10408410701647560. [DOI] [PubMed] [Google Scholar]
- 7.King DA, Peckham C, Waage JK, Brownlie J, Woolhouse MEJ. Epidemiology. Infectious diseases: Preparing for the future. Science. 2006;313(5792):1392–1393. doi: 10.1126/science.1129134. [DOI] [PubMed] [Google Scholar]
- 8.Morse SS, et al. Prediction and prevention of the next pandemic zoonosis. Lancet. 2012;380(9857):1956–1965. doi: 10.1016/S0140-6736(12)61684-5. [DOI] [PMC free article] [PubMed] [Google Scholar]
- 9.Elith J, Leathwick JR, Hastie T. A working guide to boosted regression trees. J Anim Ecol. 2008;77(4):802–813. doi: 10.1111/j.1365-2656.2008.01390.x. [DOI] [PubMed] [Google Scholar]
- 10.Breiman L. Statistical modeling: The two cultures. Stat Sci. 2001;16(3):199–231. [Google Scholar]
- 11.Jones MJ, Fielding A, Sullivan M. Analysing extinction risk in parrots using decision trees. Biodivers Conserv. 2006;15(6):1993–2007. [Google Scholar]
- 12.De’ath G, Fabricius KE. Classification and regression trees: A powerful yet simple technique for ecological data analysis. Ecology. 2000;81(11):3178–3192. [Google Scholar]
- 13.Davidson AD, Hamilton MJ, Boyer AG, Brown JH, Ceballos G. Multiple ecological pathways to extinction in mammals. Proc Natl Acad Sci USA. 2009;106(26):10702–10705. doi: 10.1073/pnas.0901956106. [DOI] [PMC free article] [PubMed] [Google Scholar]
- 14.Jones KE, et al. PanTHERIA: A species-level database of life history, ecology, and geography of extant and recently extinct mammals. Ecology. 2009;90(9):2648. [Google Scholar]
- 15.Luis AD, et al. A comparison of bats and rodents as reservoirs of zoonotic viruses: Are bats special? Proc Biol Sci. 2013;280(1756):20122753. doi: 10.1098/rspb.2012.2753. [DOI] [PMC free article] [PubMed] [Google Scholar]
- 16.Gottdenker NL, Chaves LF, Calzada JE, Saldaña A, Carroll CR. Host life history strategy, species diversity, and habitat influence Trypanosoma cruzi vector infection in changing landscapes. PLoS Negl Trop Dis. 2012;6(11):e1884. doi: 10.1371/journal.pntd.0001884. [DOI] [PMC free article] [PubMed] [Google Scholar]
- 17.Johnson PTJ, et al. Living fast and dying of infection: Host life history drives interspecific variation in infection and disease risk. Ecol Lett. 2012;15(3):235–242. doi: 10.1111/j.1461-0248.2011.01730.x. [DOI] [PubMed] [Google Scholar]
- 18.Martin LB, 2nd, Weil ZM, Nelson RJ. Immune defense and reproductive pace of life in Peromyscus mice. Ecology. 2007;88(10):2516–2528. doi: 10.1890/07-0060.1. [DOI] [PMC free article] [PubMed] [Google Scholar]
- 19.Schwanz LE. Persistent effects of maternal parasitic infection on offspring fitness: Implications for adaptive reproductive strategies when parasitized. Funct Ecol. 2008;22(4):691–698. [Google Scholar]
- 20.Wolfe ND, Dunavan CP, Diamond J. Origins of major human infectious diseases. Nature. 2007;447(7142):279–283. doi: 10.1038/nature05775. [DOI] [PMC free article] [PubMed] [Google Scholar]
- 21.McFarlane R, Sleigh A, McMichael T. Synanthropy of wild mammals as a determinant of emerging infectious diseases in the Asian-Australasian region. EcoHealth. 2012;9(1):24–35. doi: 10.1007/s10393-012-0763-9. [DOI] [PMC free article] [PubMed] [Google Scholar]
- 22.Bordes F, et al. The diversity of microparasites of rodents: A comparative analysis that helps in identifying rodent-borne rich habitats in Southeast Asia. Infect Ecol Epidemiol. 2013;2013(2013):3. doi: 10.3402/iee.v3i0.20178. [DOI] [PMC free article] [PubMed] [Google Scholar]
- 23.World Bank 2013 Country and Lending Groups by Income. Available at data.worldbank.org/about/country-and-lending-groups. Accessed September 16, 2013.
- 24.Olson DM, et al. Terrestrial ecoregions of the world: A new map of life on earth. Bioscience. 2001;51(11):933–938. [Google Scholar]
- 25.Jenkins CN, Pimm SL, Joppa LN. Global patterns of terrestrial vertebrate diversity and conservation. Proc Natl Acad Sci USA. 2013;110(28):E2602–E2610. doi: 10.1073/pnas.1302251110. [DOI] [PMC free article] [PubMed] [Google Scholar]
- 26.Martin LB, Weil ZM, Nelson RJ. Seasonal changes in vertebrate immune activity: Mediation by physiological trade-offs. Philos Trans R Soc Lond B Biol Sci. 2008;363(1490):321–339. doi: 10.1098/rstb.2007.2142. [DOI] [PMC free article] [PubMed] [Google Scholar]
- 27.Ostfeld RS, et al. Life history and demographic drivers of reservoir competence for three tick-borne zoonotic pathogens. PLoS ONE. 2014;9(9):e107387. doi: 10.1371/journal.pone.0107387. [DOI] [PMC free article] [PubMed] [Google Scholar]
- 28.Altizer S, Ostfeld RS, Johnson PTJ, Kutz S, Harvell CD. Climate change and infectious diseases: From evidence to a predictive framework. Science. 2013;341(6145):514–519. doi: 10.1126/science.1239401. [DOI] [PubMed] [Google Scholar]
- 29.Rabinowitz P, Conti L. Links among human health, animal health, and ecosystem health. Annu Rev Public Health. 2013;34(1):189–204. doi: 10.1146/annurev-publhealth-031912-114426. [DOI] [PubMed] [Google Scholar]
- 30.Estrada-Peña A, Ostfeld RS, Peterson AT, Poulin R, de la Fuente J. Effects of environmental change on zoonotic disease risk: An ecological primer. Trends Parasitol. 2014;30(4):205–214. doi: 10.1016/j.pt.2014.02.003. [DOI] [PubMed] [Google Scholar]
- 31.Patz JA, et al. Working Group on Land Use Change and Disease Emergence Unhealthy landscapes: Policy recommendations on land use change and infectious disease emergence. Environ Health Perspect. 2004;112(10):1092–1098. doi: 10.1289/ehp.6877. [DOI] [PMC free article] [PubMed] [Google Scholar]
- 32.Bonds MH, Dobson AP, Keenan DC. Disease ecology, biodiversity, and the latitudinal gradient in income. PLoS Biol. 2012;10(12):e1001456. doi: 10.1371/journal.pbio.1001456. [DOI] [PMC free article] [PubMed] [Google Scholar]
- 33.Ngonghala CN, et al. Poverty, disease, and the ecology of complex systems. PLoS Biol. 2014;12(4):e1001827. doi: 10.1371/journal.pbio.1001827. [DOI] [PMC free article] [PubMed] [Google Scholar]
- 34.Viana M, et al. Assembling evidence for identifying reservoirs of infection. Trends Ecol Evol. 2014;29(5):270–279. doi: 10.1016/j.tree.2014.03.002. [DOI] [PMC free article] [PubMed] [Google Scholar]
- 35.Hamilton MJ, Davidson AD, Sibly RM, Brown JH. Universal scaling of production rates across mammalian lineages. Proc Biol Sci. 2011;278(1705):560–566. doi: 10.1098/rspb.2010.1056. [DOI] [PMC free article] [PubMed] [Google Scholar]
- 36. IUCN (2014) Terrestrial Mammals. Available at www.iucnredlist.org/technical-documents/spatial-data. Accessed August 16, 2013.
- 37.Haydon DT, Cleaveland S, Taylor LH, Laurenson MK. Identifying reservoirs of infection: A conceptual and practical challenge. Emerg Infect Dis. 2002;8(12):1468–1473. doi: 10.3201/eid0812.010317. [DOI] [PMC free article] [PubMed] [Google Scholar]
- 38.Berger SA. GIDEON: A comprehensive Web-based resource for geographic medicine. Int J Health Geogr. 2005;4(1):10. doi: 10.1186/1476-072X-4-10. [DOI] [PMC free article] [PubMed] [Google Scholar]
- 39.Wilson DE, Reeder DM. Mammal Species of the World: A Taxonomic and Geographic Reference. JHU Press; Baltimore: 2005. [Google Scholar]
- 40.Ridgeway G. 2013 gbm: Generalized Boosted Regression Models. Available at cran.r-project.org/web/packages/gbm/index.html. Accessed August 15, 2013.
- 41.R Core Team 2014 R: A Language and Environment for Statistical Computing. Available at www.R-project.org/. Accessed October 23, 2014.
- 42.ESRI . ArcGIS Desktop: Release 10. Environmental Systems Research Institute; Redlands, CA: 2011. [Google Scholar]
Associated Data
This section collects any data citations, data availability statements, or supplementary materials included in this article.