

Abstract
Limited information on age- and sex-specific estimates of influenza-associated death with different underlying causes is currently available. We regressed weekly age- and sex-specific US mortality outcomes underlying several causes between 1997 and 2007 to incidence proxies for influenza A/H3N2, A/H1N1, and B that combine data on influenzalike illness consultations and respiratory specimen testing, adjusting for seasonal baselines and time trends. Adults older than 75 years of age had the highest average annual rate of influenza-associated mortality, with 141.15 deaths per 100,000 people (95% confidence interval (CI): 118.3, 163.9), whereas children under 18 had the lowest average mortality rate, with 0.41 deaths per 100,000 people (95% CI: 0.23, 0.60). In addition to respiratory and circulatory causes, mortality with underlying cancer, diabetes, renal disease, and Alzheimer disease had a contribution from influenza in adult age groups, whereas mortality with underlying septicemia had a contribution from influenza in children. For adults, within several age groups and for several underlying causes, the rate of influenza-associated mortality was somewhat higher in men than in women. Of note, in men 50–64 years of age, our estimate for the average annual rate of influenza-associated cancer mortality per 100,000 persons (1.90, 95% CI: 1.20, 2.62) is similar to the corresponding rate of influenza-associated respiratory deaths (1.81, 95% CI: 1.42, 2.21). Age, sex, and underlying health conditions should be considered when planning influenza vaccination and treatment strategies.
Keywords: age, influenza, mortality, sex, underlying cause
Substantial uncertainty still exists regarding the burden of influenza-associated mortality with underlying causes outside of the respiratory and the circulatory disease categories. In fact, the estimation procedures adopted by the US Centers for Disease Control and Prevention (CDC) restrict the estimation of influenza-associated mortality to deaths with underlying respiratory and circulatory causes (1, 2). Although the contribution of influenza to the rates of all-cause mortality has also been assessed in numerous other studies (3, 4), part of that contribution comes from underlying causes of death outside of the respiratory and the circulatory disease categories, and the impact of influenza on mortality with underlying causes other than the respiratory and the circulatory causes is rarely estimated. In a recent article (5), we proposed a method for estimating influenza-associated mortality that involved regressing weekly mortality outcomes linearly against proxies for disease incidence of the 3 major co-circulating influenza subtypes (A/H3N2, A/H1N1, and B) that combine data on influenzalike illness consultations and respiratory specimen testing and adjusting for temporal trend and a seasonal baseline modeled by periodic cubic splines. The model in our article (5) exhibited a statistically significant contribution of influenza to mortality with underlying respiratory and circulatory causes, as well as with several other underlying causes frequently present in adults hospitalized for influenza: diabetes, cancer, Alzheimer disease, renal disease, and chronic liver disease. The inference method developed in our previous article (5) can be used to examine the mortality burden of influenza in various population subgroups with the purpose of extracting information that could be used to guide influenza vaccination and treatment strategies. One natural way in which a population can be stratified into subgroups is by age, which is known to be a major predictor for the risk of influenza-associated death (3, 6). In addition to age, influenza-related morbidity and mortality rates have been hypothesized to vary by sex (7–9), and this research area is gaining salience in influenza policy, with a 2010 World Health Organization report that stressed that sex should be considered when evaluating influenza exposure and outcomes (9, 10). In the present article, we describe the estimation of influenza-related mortality between 1997 and 2007 for several underlying causes of death by varying age groups and sex as an application of an inference method adopted from Goldstein et al. (5).
MATERIALS AND METHODS
Ethics statement
Aggregated regional and national level data were used in the analyses. No informed consent was sought for the purposes of the study, and no institutional review board approval was required.
Mortality data and outcomes
Weekly mortality data from 1997 to 2007 were obtained from the US National Center for Health Statistics database. Mortality data were stratified by week, age, sex, and underlying cause (11) classified using the International Classification of Diseases, Ninth and Tenth Revisions. Conversion factors were applied for classification changes from the ninth to the tenth revision in 1999 (12). We categorized age into 5 groups: children (<18 years of age), young adults (18–49 years of age), adults (50–64 years of age), and seniors (65–74 and ≥75 years of age). To analyze the contribution of influenza to mortality, we used all-cause mortality data, as well as data for several specific causes of death: all circulatory causes, heart disease, cerebrovascular disease, myocardial infarction, all respiratory causes, lower respiratory disease, pneumonia and influenza, cancer, diabetes, renal disease, chronic liver disease, central nervous system disease, Alzheimer disease, septicemia, and unintentional injuries (eTable 1 in reference 5). The mortality rate for cause(s) c in age group a, sex s, and week t was denoted as Mc,a,s(t).
Incidence proxies and their estimation from data
Ten influenza seasons, from 1997–1998 to 2006–2007, were used in the analysis. An influenza season was defined as the time between calendar week 40 of a given year and week 20 of the following calendar year (October–May influenza surveillance period; 13). For estimation of incidence proxies, we used methods previously described by Goldstein et al. (5, 14). We relied on 2 sources of weekly disease data from the US CDC (13, 15): 1) viral surveillance data that report the number of respiratory specimens tested and the number that are positive for influenza (sub)types and 2) illness surveillance data that report the total number of patients seen and the number of patients with influenzalike illness in the US Outpatient Influenza-like Illness Surveillance Network. Incidence proxies for influenza A/H3N2, A/H1N1, and B for a given week were defined as the proportion of influenzalike illness among all outpatient visits to physicians partaking in the sentinel surveillance system multiplied by the proportion of respiratory isolates that tested positive for a particular subtype, weighted by regional populations for 10 regions as defined by the US Department of Health and Human Services (14). The incidence proxies of influenza A/H3N2, A/H1N1, and B were denoted as H3 (t), H1 (t), and B (t) for week t in the data. Weekly incidence proxies for the 3 subtypes were set to 0 for the non–influenza season weeks. The influenza A/H3N2 proxy was split into 2 time periods to account for the emergence of the novel influenza A/H3N2/Fujian/2003 strain in 2003–2004, with H31 (t) representing incidence for the period from 1997 to the middle of 2003 (H31 was set to 0 after mid-2003) and H32 (t) representing the incidence after mid-2003.
Statistical analysis
We regressed cause-, age-, and sex-specific mortality outcomes to incidence proxies using linear models detailed in reference 5 after adjusting for baseline seasonality and temporal trends, as explained below. For each mortality category (age cohort, sex, and a collection of underlying causes), the baseline non–influenza-related mortality rate for each calendar week was defined as the non–influenza-related mortality rate for that week averaged over the years during the study period. This baseline, Baseline (t), accounted for the mortality impact of the introduction of the pneumococcal conjugate vaccine (PCV7) in 2000 (16–20), following this equation:
Here, Base1 (t) represents the periodic (52-week period) baseline non-influenza mortality rate before week 23 of 2001 and is set to 0 after week 23 of 2001. Base2 (t) represents the periodic baseline in the presence of the pneumococcal vaccine (after week 23 of 2001) and is 0 before week 23 of 2001. Periodic cubic splines with a knot every 4 weeks were used to model the baseline rates, Base1 (t), and Base2 (t) (5).
According to the CDC influenza surveillance data, 2 years (1997 and 2003) had 53 epidemiologic weeks (13). Mortality data for 1 week in mid-July 1999 and 1 week in 2004 were discarded to maintain consistent 52-week periodic baseline rates. As a result, the influenza seasons for 1997–1998 and 2003–2004 ended on calendar week 19 as opposed to calendar week 20.
We used the following model to relate mortality for a collection of causes (c), age (a), and sex (s) to influenza circulation:
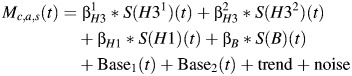 | (1) |
The operator S (applied to each incidence proxy) is the forward-shifting operator that represents a lag between infection/incidence and deaths (typically estimated to be in the order of 1–2 weeks), and the trend is a (low-degree) polynomial in the calendar year (5). Ordinary least squares inference was used to produce (unbiased) estimates of the regression parameters. Bootstrap estimates of the confidence bounds, using a model for the autocorrelated noise structure, were obtained using the methodology described by Goldstein et al. (5). Statistical analyses were conducted using R, version 2.14 (R Foundation for Statistical Computing, Vienna, Austria).
RESULTS
Annual estimates of all-cause influenza-associated mortality rates by age
From the 1997–1998 influenza seasons to the 2006–2007 season, the overall average all-cause mortality rate due to influenza in the United States was 11.78 per 100,000 deaths (95% confidence interval (CI): 10.34, 13.17), and the influenza-related mortality rates sharply increased with age (Table 1). The elderly had the highest average all-cause influenza-associated mortality rate of 141.15 (95% CI: 118.32, 163.85) annual deaths per 100,000 people. That rate declined to 26.37 (95% CI: 22.06, 30.53) for those aged 65–74 years, 7.18 (95% CI: 5.85, 8.40) for those aged 50–64 years, and 1.03 (95% CI: 0.58, 1.48) for those aged 18–49 years. Children had the lowest overall average all-cause influenza-associated mortality rates, with a rate of 0.41 annual deaths per 100,000 people (95% CI: 0.23, 0.60). Weekly model fitted to all-cause mortality data in different age groups are plotted in Figure 1.
Table 1.
Age-specific Estimates of Annual All-Cause Influenza-associated Mortality Rates Per 100,000 Persons, United States, 1997–2007
| Season, Dominant Influenza Subtype | Age, years | |||||||||||
|---|---|---|---|---|---|---|---|---|---|---|---|---|
| <18 | 18–49 | 50–64 | 65–74 | ≥75 | All | |||||||
| Estimate Per 100,000 Persons | 95% CI | Estimate Per 100,000 Persons | 95% CI | Estimate Per 100,000 Persons | 95% CI | Estimate Per 100,000 Persons | 95% CI | Estimate Per 100,000 Persons | 95% CI | Estimate Per 100,000 Persons | 95% CI | |
| 1997–1998, A/H3N2 | 0.39 | 0.14, 0.63 | 0.97 | 0.39, 1.58 | 9.59 | 7.79, 11.31 | 40.24 | 34.29, 46.05 | 197.81 | 166.8, 228.8 | 16.09 | 14.19, 17.93 |
| 1998–1999, A/H3N2 | 0.44 | 0.12, 0.78 | 1.42 | 0.61, 2.22 | 12.00 | 9.62, 14.36 | 46.47 | 38.18, 54.30 | 256.05 | 212.0, 298.3 | 20.57 | 17.91, 23.12 |
| 1999–2000, A/H3N2 | 0.38 | 0.14, 0.61 | 0.90 | 0.36, 1.47 | 8.90 | 7.24, 10.59 | 36.91 | 31.27, 42.40 | 179.69 | 150.8, 208.6 | 14.85 | 13.04, 16.62 |
| 2000–2001, A/H1N1 | 0.42 | 0.15, 0.70 | 0.66 | −0.01, 1.32 | 4.60 | 2.63, 6.61 | 8.74 | 1.95, 14.95 | 45.39 | 9.74, 82.17 | 4.37 | 2.18, 6.67 |
| 2001–2002, A/H3N2 | 0.32 | 0.12, 0.51 | 0.86 | 0.37, 1.33 | 7.62 | 6.24, 8.93 | 29.74 | 25.00, 34.27 | 155.54 | 131.7, 179.6 | 12.82 | 11.32, 14.31 |
| 2002–2003, A/H1N1,B | 0.33 | 0.13, 0.56 | 0.60 | 0.05, 1.10 | 4.27 | 2.71, 5.85 | 9.98 | 4.54, 14.95 | 53.71 | 25.58, 82.39 | 4.89 | 3.17, 6.68 |
| 2003–2004, A/H3N2 | 0.56 | 0.28, 0.84 | 1.72 | 1.11, 2.35 | 7.82 | 5.72, 9.83 | 35.20 | 28.89, 41.63 | 197.40 | 158.8, 235.1 | 16.28 | 13.91, 18.68 |
| 2004–2005, A/H3N2 | 0.37 | 0.12, 0.63 | 1.40 | 0.76, 2.10 | 6.88 | 5.03, 8.83 | 26.52 | 20.70, 32.54 | 170.16 | 133.7, 205.0 | 13.80 | 8.46, 11.21 |
| 2005–2006, A/H3N2 | 0.34 | 0.18, 0.51 | 1.05 | 0.65, 1.50 | 5.18 | 4.00, 6.39 | 19.77 | 16.14, 23.57 | 118.63 | 95.84, 140.6 | 9.86 | 8.46, 11.21 |
| 2006–2007, A/H1N1 | 0.56 | 0.26, 0.86 | 0.74 | 0.04, 1.48 | 4.91 | 2.73, 7.15 | 10.15 | 3.30, 17.13 | 37.15 | −2.66, 79.67 | 4.24 | 1.70, 6.80 |
| Overall average | 0.41 | 0.23, 0.60 | 1.03 | 0.58, 1.48 | 7.18 | 5.85, 8.40 | 26.37 | 22.06, 30.53 | 141.15 | 118.3, 163.8 | 11.78 | 10.34, 13.17 |
Abbreviation: CI, confidence interval.
Figure 1.

Weekly all-cause mortality rates per 100,000 people (solid lines) and model fits (circles) in different age groups, United States, 1997–2007. A) Persons 0–17 years of age; B) persons 18–49 years of age; C) persons 50–64 years of age; D) persons 65–74 years of age; E) persons 75 years of age or older.
Annual influenza-associated all-cause mortality estimates varied year to year for each age group (Table 1). For individuals aged 50–64, 65–74, and 75 years or older, the highest mortality rates were estimated to have happened in the late 1990s and were primarily associated with influenza A/H3N2. For children, the highest influenza-associated mortality rates were during the 2003–2004 season, when the Fujian A/H3N2 strain had emerged, and during the 2006–2007 season, which was dominated by influenza A/H1N1. Further information of subtype-specific mortality in different age groups is presented in Web Appendix 1 (available at http://aje.oxfordjournals.org/).
Baseline rates of non-influenza all-cause mortality
Weekly all-cause mortality baseline rates, Base1 (t) and Base2 (t), before and after the 2001 introduction of PCV7 were plotted for each age group (Figure 2). A shift in the estimated baseline all-cause mortality rate from fall and winter toward early spring in the period after the introduction of PCV7 was observed across all age groups. A reduction in the “holiday bump” of weekly morality rates was observed across all age groups except children. Early summertime peaks in weekly non–influenza-related mortality rates were observed for children both before and after 2001. For the other age groups, baseline peaks around calendar week 1 were observed.
Figure 2.

Baseline rates of non–influenza-associated all-cause mortality in different age groups before (1997–mid 2001, solid line) and after (mid 2001–2007, dashed line) the introduction of the pneumococcal conjugate vaccine, United States, 1997–2007. A) Persons 0–17 years of age; B) persons 18–49 years of age; C) persons 50–64 years of age; D) persons 65–74 years of age; E) persons 75 years of age or older.
Age and sex analysis for specific mortality causes
Variations in influenza-associated mortality rates among age groups and by sex were observed for different underlying causes of death (Tables 2–4). Compared with women in the same age groups, men 50–64 and 65–74 years of age had higher rates of all-cause influenza-associated deaths, men 18–49 and 65–74 years of age had higher rates of influenza-associated circulatory system–related deaths, and men 50–64 years of age had a higher rate of influenza-associated deaths with underlying heart disease. The rate of influenza-associated mortality with underlying cancer in men aged 50–64 years (1.9 per 100,000 people, 95% CI: 1.2, 2.62) was 2.4 times higher than the corresponding rate for women. This rate was similar to our estimate of 1.81 per 100,000 people (95% CI: 1.42, 2.21) for influenza-associated respiratory system–related mortality in men aged 50–64 years. Men also had higher rates than women of influenza-associated mortality with underlying respiratory system disease (65–74 years of age), chronic lower respiratory disease (65–74 and 75 years of age or older), myocardial infarctions (50–64 and 65–74 years of age), and renal disease (≥75 years of age). For women in the 75 years of age or older group (who were on average older than men in the same age stratum), the rate of influenza-associated deaths with underlying Alzheimer disease was higher than the corresponding rate for men.
Table 2.
Average Annual Influenza-associated Mortality Estimates per 100,000 Persons Among Male Subjects by Age for Various Underlying Causes, United States, 1997–2007
| Underlying Cause | Age, years | |||||||||
|---|---|---|---|---|---|---|---|---|---|---|
| <18 | 18–49 | 50–64 | 65–74 | ≥75 | ||||||
| Estimate Per 100,000 Persons | 95% CI | Estimate Per 100,000 Persons | 95% CI | Estimate Per 100,000 Persons | 95% CI | Estimate Per 100,000 Persons | 95% CI | Estimate Per 100,000 Persons | 95% CI | |
| All causes | 0.40 | 0.15, 0.65 | 1.17 | 0.52, 1.85 | 8.64 | 6.73, 10.61 | 29.93 | 24.52, 35.39 | 139.46 | 115.9, 162.4 |
| All circulatory | 0.00 | −0.05, 0.07 | 0.22 | 0.06, 0.38 | 2.75 | 1.65, 3.87 | 12.35 | 9.43, 15.28 | 53.81 | 42.9, 64.4 |
| Heart disease | 0.03 | 0.002, 0.07 | 0.24 | 0.11, 0.38 | 2.82 | 1.84, 3.81 | 11.03 | 8.33, 13.74 | 43.29 | 34.9, 51.7 |
| Ischemic heart disease | 0.01 | 0.002, 0.01 | 0.16 | 0.05, 0.26 | 2.1 | 1.3, 2.94 | 8.44 | 6.22, 10.8 | 31.56 | 25.1, 38.1 |
| Myocardial infarction | 0.00 | −0.002, 0.01 | 0.05 | −0.02, 0.12 | 1.18 | 0.73, 1.64 | 3.56 | 2.4, 4.64 | 11.2 | 8.3, 14.1 |
| Cerebrovascular diseases | 0.00 | −0.02, 0.02 | 0.02 | −0.03, 0.07 | 0.17 | −0.07, 0.4 | 1.21 | 0.50, 1.97 | 8.8 | 6.37, 11.2 |
| All respiratory | 0.13 | 0.08, 0.18 | 0.26 | 0.2, 0.32 | 1.81 | 1.42, 2.21 | 10.25 | 8.59, 11.89 | 42.99 | 35.9, 50.2 |
| Pneumonia and influenza | 0.12 | 0.09, 0.15 | 0.19 | 0.15, 0.22 | 0.63 | 0.47, 0.78 | 2.24 | 1.76, 2.76 | 21.21 | 18.45, 23.94 |
| Chronic lower respiratory | −0.2 | −0.03, 0.001 | 0.05 | 0.02, 0.08 | 1.12 | 0.86, 1.4 | 7.06 | 5.9, 8.22 | 20.12 | 17.08, 23.27 |
| Cancer | 0.03 | −0.02, 0.08 | 0.05 | −0.08, 0.18 | 1.9 | 1.2, 2.62 | 1.4 | −0.62, 3.57 | 10.35 | 7.12, 13.57 |
| Diabetes | 0.00 | −0.01, 0.004 | 0.09 | 0.05, 0.13 | 0.36 | 0.13, 0.58 | 1.1 | 0.47, 1.74 | 3.17 | 2.13, 4.23 |
| Renal disease | −0.01 | −0.03, 0.01 | 0.03 | 0.01, 0.06 | 0.11 | −0.01, 0.23 | 0.59 | 0.19, 0.98 | 3.19 | 2.02, 4.41 |
| Chronic liver disease | 0.00 | −0.01, 0.001 | 0.05 | −0.01, 0.11 | 0.34 | 0.12, 0.55 | −0.24 | −0.63, 0.18 | 0.22 | −0.22, 0.66 |
| Central nervous system disease | 0.00 | −0.01, 0.001 | 0.01 | 0.004, 0.02 | 0.11 | 0.05, 0.17 | 0.42 | 0.1, 0.74 | 3.87 | 2.27, 5.38 |
| Alzheimer disease | 0.00 | −0.001, 0.001 | 0.00 | −0.002, 0.01 | 0.08 | 0.03, 0.12 | 0.39 | 0.09, 0.7 | 3.84 | 2.43, 5.37 |
| Septicemia | 0.04 | 0.02, 0.07 | −0.04 | −0.13, 0.05 | −0.44 | −1.23, 0.40 | −0.79 | −3.15, 1.43 | −0.47 | −4.62, 3.85 |
| Unintentional injuries | 0.06 | −0.08, 0.20 | 0.16 | −0.09, 0.40 | −0.04 | −0.36, 0.26 | 0.55 | 0.04, 1.07 | 0.86 | −0.24, 1.95 |
| % All-cause explained | 63 | 72 | 80 | 86 | 85 | |||||
Abbreviation: CI, confidence interval.
Table 3.
Average Annual Influenza-associated Mortality Estimates per 100,000 Persons Among Female Subjects by Age for Various Underlying Causes, United States, 1997–2007
| Underlying Causes | Age, years | |||||||||
|---|---|---|---|---|---|---|---|---|---|---|
| <18 | 18–49 | 50–64 | 65–74 | ≥75 | ||||||
| Estimate Per 100,000 Persons | 95% CI | Estimate Per 100,000 Persons | 95% CI | Estimate Per 100,000 Persons | 95% CI | Estimate Per 100,000 Persons | 95% CI | Estimate Per 100,000 Persons | 95% CI | |
| All causes | 0.40 | 0.16, 0.63 | 0.90 | 0.56, 1.2 | 5.72 | 4.62, 6.82 | 23.47 | 19.77, 27.2 | 142.17 | 118.3, 165.8 |
| All circulatory | −0.01 | −0.07, 0.04 | 0.01 | −0.11, 0.13 | 1.55 | 1.02, 2.07 | 7.4 | 5.75, 8.97 | 62.45 | 51.9, 73.6 |
| Heart disease | 0.02 | −0.01, 0.06 | 0.08 | −0.02, 0.17 | 1.65 | 1.26, 2.07 | 6.96 | 5.75, 8.15 | 48.79 | 40.9, 56.9 |
| Ischemic heart disease | 0.00 | −0.01, 0.01 | 0.05 | 0.002, 0.1 | 1.15 | 0.85, 1.48 | 4.79 | 3.8, 5.83 | 33.1 | 27.5, 38.8 |
| Myocardial infarction | 0.00 | −0.004, 0.01 | 0.05 | 0.02, 0.09 | 0.4 | 0.17, 0.63 | 2.08 | 1.44, 2.73 | 12.51 | 10.54, 14.46 |
| Cerebrovascular diseases | −0.01 | −0.03, 0.01 | −0.04 | −0.08, 0.001 | 0.09 | −0.1, 0.29 | 0.87 | 0.28, 1.46 | 9.89 | 7.41, 12.41 |
| All respiratory | 0.14 | 0.10, 0.18 | 0.24 | 0.19, 0.3 | 2.19 | 1.89, 2.53 | 7.94 | 6.51, 9.35 | 40.93 | 33.9, 48.04 |
| Pneumonia and influenza | 0.12 | 0.09, 0.14 | 0.19 | 0.16, 0.22 | 0.73 | 0.61, 0.86 | 2.09 | 1.63, 2.53 | 23.63 | 20.8, 26.55 |
| Chronic lower respiratory | 0.01 | −0.01, 0.02 | 0.03 | −0.002, 0.06 | 1.35 | 1.09, 1.61 | 5.46 | 4.42, 6.47 | 15.06 | 12.74, 17.52 |
| Cancer | −0.02 | −0.06, 0.03 | 0.14 | 0.01, 0.27 | 0.79 | 0.15, 1.44 | 1.73 | 0.27, 3.18 | 6.63 | 4.7, 8.64 |
| Diabetes | 0.00 | −0.01, 0.01 | 0.05 | 0.01, 0.09 | 0.22 | 0.02, 0.42 | 1.24 | 0.72, 1.75 | 2.07 | 1.08, 3.06 |
| Renal disease | 0.00 | −0.02, 0.01 | 0.03 | 0.004, 0.05 | 0.07 | −0.06, 0.2 | 0.78 | 0.46, 1.11 | 1.67 | 1.04, 2.31 |
| Chronic liver disease | 0.00 | −0.01, 0.003 | 0.05 | 0.01, 0.09 | 0.09 | −0.03, 0.21 | 0.15 | −0.11, 0.41 | 0.13 | −0.15, 0.39 |
| Central nervous system disease | 0.00 | −0.01, 0.001 | 0.00 | −0.01, 0.01 | 0.06 | 0.02, 0.11 | 0.34 | 0.05, 0.62 | 6.8 | 4.6, 9.06 |
| Alzheimer disease | 0.00 | −0.001, 0.001 | 0.00 | −0.004, 0.003 | 0.06 | 0.02, 0.1 | 0.29 | 0.02, 0.57 | 6.74 | 4.54, 9.01 |
| Septicemia | 0.04 | 0.02, 0.06 | 0.00 | −0.05, 0.06 | −0.24 | −0.85, 0.35 | −0.63 | −2.61, 1.47 | 0.82 | −2.72, 4.53 |
| Unintentional injuries | 0.01 | −0.1, 0.11 | 0.06 | −0.05, 0.17 | 0.11 | −0.07, 0.29 | 0.21 | −0.15, 0.56 | 1.2 | 0.43, 1.99 |
| % All-cause explained | 38 | 64 | 85 | 82 | 86 | |||||
Abbreviation: CI, confidence interval.
Table 4.
Sex Difference Between Average Annual Influenza-associated Mortality Estimates Per 100,000 Persons (Males – Females) by Age for Various Underlying Causes, United States, 1997–2007
| Underlying Cause | Age, years | |||||||||
|---|---|---|---|---|---|---|---|---|---|---|
| <18 | 18–49 | 50–64 | 65–74 | ≥75 | ||||||
| Estimate Per 100,000 Persons | 95% CI | Estimate Per 100,000 Persons | 95% CI | Estimate Per 100,000 Persons | 95% CI | Estimate Per 100,000 Persons | 95% CI | Estimate Per 100,000 Persons | 95% CI | |
| All causes | 0.01 | −0.35, 0.36 | 0.27 | −0.46, 0.98 | 2.92 | 0.69, 5.14 | 6.46 | 0.04, 12.91 | −2.71 | 35.5, 29.4 |
| All circulatory | 0.02 | −0.06, 0.1 | 0.21 | 0.02, 0.42 | 1.2 | −0.01, 2.42 | 4.94 | 1.64, 8.33 | −8.64 | −23.9, 6.7 |
| Heart disease | 0.01 | −0.04, 0.06 | 0.17 | −0.003, 0.33 | 1.17 | 0.05, 2.28 | 4.07 | 1.15, 6.88 | −5.5 | −17.4, 6.2 |
| Ischemic heart disease | 0.01 | −0.004, 0.02 | 0.11 | −0.01, 0.22 | 0.95 | 0.1, 1.85 | 3.65 | 1.15, 6.18 | −1.55 | −10.1, 7.1 |
| Myocardial infarction | 0.00 | −0.01, 0.01 | 0.00 | −0.08, 0.07 | 0.78 | 0.27, 1.29 | 1.48 | 0.14, 2.74 | −1.3 | −4.7, 2.3 |
| Cerebrovascular diseases | 0.00 | −0.03, 0.03 | 0.06 | −0.01, 0.12 | 0.07 | −0.24, 0.38 | 0.33 | −0.58, 1.29 | −1.09 | −4.5, 2.4 |
| All respiratory | −0.01 | −0.07, 0.06 | 0.01 | −0.07, 0.1 | −0.38 | −0.9, 0.12 | 2.31 | 0.2, 4.51 | 2.06 | −8.1, 11.9 |
| Pneumonia and influenza | 0.00 | −0.04, 0.04 | 0.00 | −0.05, 0.04 | −0.11 | −0.3, 0.08 | 0.15 | −0.5, 0.81 | −2.42 | −6.33, 1.54 |
| Chronic lower respiratory | −0.02 | −0.05, 0.00 | 0.02 | −0.02, 0.06 | −0.23 | −0.61, 0.14 | 1.6 | 0.12, 3.18 | 5.06 | 1.09, 9.02 |
| Cancer | 0.05 | −0.01, 0.12 | −0.09 | −0.27, 0.09 | 1.11 | 0.12, 2.05 | −0.33 | −2.84, 2.15 | 3.72 | −0.13, 7.62 |
| Diabetes | 0.00 | −0.01, 0.01 | 0.05 | −0.01, 0.1 | 0.14 | −0.15, 0.43 | −0.14 | −0.95, 0.69 | 1.1 | −0.34, 2.59 |
| Renal disease | −0.01 | −0.03, 0.01 | 0.00 | −0.03, 0.04 | 0.04 | −0.13, 0.22 | −0.19 | −0.72, 0.34 | 1.52 | 0.16, 2.89 |
| Chronic liver disease | 0.00 | −0.01, 0.004 | 0.00 | −0.07, 0.07 | 0.25 | −0.001, 0.49 | −0.39 | −0.86, 0.11 | 0.1 | −0.42, 0.62 |
| Central nervous system disease | 0.00 | −0.01, 0.02 | 0.01 | 0.001, 0.02 | 0.05 | −0.03, 0.12 | 0.08 | −0.36, 0.50 | −2.93 | −5.62, 0.23 |
| Alzheimer disease | 0.00 | −0.001, 0.001 | 0.00 | −0.002, 0.01 | 0.02 | −0.04, 0.08 | 0.09 | −0.31, 0.52 | −2.9 | −5.54, 0.24 |
| Septicemia | 0.00 | −0.03, 0.04 | −0.04 | −0.14, 0.06 | −0.21 | −1.21, 0.82 | −0.16 | −3.37, 2.73 | −1.28 | −6.64, 4.22 |
| Unintentional injuries | 0.05 | −0.12, 0.23 | 0.1 | −0.16, 0.37 | −0.15 | −0.51, 0.18 | 0.33 | −0.29, 0.95 | −0.35 | −1.65, 0.99 |
Abbreviation: CI, confidence interval.
For both men and women aged 50–64 and 65–74 years, over 61% of influenza-associated respiratory disease–related deaths were due to chronic lower respiratory disease. For men and women older than 75 years of age, the proportion of all influenza-associated deaths with underlying pneumonia and influenza was higher than the corresponding proportions for those aged 50–64 and 65–74 years.
The percentage of all-cause influenza-related mortality estimates explained by estimates from the disjoint underlying causes (all circulatory, all respiratory, cancer, diabetes, renal disease, chronic liver disease, Alzheimer disease, septicemia, and unintentional injuries) generally increased as age increased. This percentage varied between 80% and 86% for men and women aged 50–64, 65–74, and 75 years or older. Children (particularly girls) had the lowest percentage of all-cause influenza-associated mortality explained by the underlying causes considered in our analysis, with a statistically significant contribution of influenza to all-cause mortality and mortality with underlying respiratory causes and septicemia for both sexes, as well as to mortality with underlying heart disease for boys.
DISCUSSION
Application of a novel inference method has allowed for an estimation of the burden of influenza between 1997 and 2007 on all-cause mortality and on deaths with various specific underlying causes, stratified by age and sex. Such information can be used to highlight the risks experienced by certain population subgroups to both members of those groups and their medical providers in order to promote vaccination, the practice of seeking prompt medical treatment upon an onset of influenzalike symptoms, and adherence to antiviral usage guidelines in those subgroups (as exemplified by an advisory issued by the CDC amid the 2012–2013 influenza season (21)).
Although age-stratified analyses of influenza mortality burden have previously been conducted using traditional methods (3, 22), few studies have explored age and sex patterns for a collection of underlying causes. Our results are generally consistent with previous work in terms of the share of deaths with underlying respiratory and circulatory system disease among all influenza-associated mortality (3) and in terms of the share of the elderly among all influenza-associated mortality (1–3). We also note, as we did previously (5), that although our estimates for the numbers of influenza-associated respiratory and circulatory system–related deaths are noticeably different from the estimates of Thompson et al. (1) for the corresponding time period, that difference might largely stem from the fact Thompson et al. used a longer time period (1976–2007) for inference, with changes in the CDC virological surveillance system taking place during that time period. Restricting the Poisson regression inference method (2, 3) to the 1997–2007 period produced estimates for influenza-associated respiratory and circulatory system–related deaths that were similar to the ones in our study. Finally, our estimates for all-age mortality rates (Table 1) are also quite similar to the results published by Goldstein et al. using the same methodology, with an average annual rate of 11.78 influenza-associated deaths per 100,000 persons versus that of 11.92 found in reference 5. Some of the differences may in part be a consequence of the post-census updates in population estimates and may also be in part because of the fact that we have extrapolated overall annual influenza-associated mortality rates from the estimates for the different age groups, whereas the estimates in the article by Goldstein et al. (5) were obtained from an all-age mortality inference.
Our knowledge of the rate of influenza-associated mortality in children is limited. We have estimated an average rate of 0.41 annual deaths per 100,000 children (95% CI: 0.23, 0.60) between 1997 and 2007. Influenza A/H1N1 caused a larger fraction of influenza-associated deaths in children than in adults (Web Tables 1–5), with similar rates of influenza-associated pediatric mortality in H3N2-dominant and H1N1-dominant seasons on average. This is in line with previous mortality studies (3, 23) and the concept that A/H1N1 viruses primarily infect children, whereas A/H3N2 infections have broader age distributions (24).
We have found from the model that for adults in several age groups, influenza-associated mortality rates are higher in male subjects than in female subjects for certain underlying causes (e.g., circulatory causes). At the same time, overall mortality rates for those underlying causes and age groups were higher in male subjects than in female subjects. Some of the most pronounced sex differences for influenza-associated mortality were for deaths with underlying myocardial infarctions. Among 50–64-year-old adults, men had a rate of influenza-associated death with underlying myocardial infarctions that was 2.95 times the corresponding rate among women; the corresponding ratio in death rates is 1.71 for 65–74-year-old adults. Those ratios are in good correspondence with the ratios of rates for all myocardial infarction deaths in men versus women, which were 2.70 for ages 50–64 and 1.99 for ages 65–74 in the 1997–2007 data. Other studies have found an association between acute myocardial infarction and influenza, although sex was not included the analysis (25). In a recent study, infection during the influenza season was found to be associated with increased risk of first acute myocardial infarction (26). Though the biologic link between influenza and myocardial infarction has not been fully established, it is believed that atherosclerotic plaques are destabilized because of the systemic prothrombotic and proinflammatory effects of influenza, which can lead to myocardial infarction (27–29). The higher propensity for myocardial infarction among men compared with women in these age groups (30) could explain the higher rate of influenza-associated myocardial infarction deaths among men.
Across all age groups, the model indicated that the annual baseline rates for non-influenza mortality changed after the introduction of PCV7 in 2000. This corresponds to previous findings about the impact of PCV7 on the overall population annual mortality baseline and reduction in the “holiday season bump” (5, 16, 17, 19, 20). Comparative studies using data from other countries in which pneumococcal conjugate vaccines were introduced at different times will be useful in assessing the causal role of PCV7 in this change.
Our study has several limitations. Because of the assumption of a constant case fatality rate for each influenza subtype during the studied time period (apart from the change for H3N2 in 2003–2004), season-specific estimates may be less reliable than the average estimates. In Web Appendix 2, we show analogous analyses with influenza A/H1N1 and B incidence proxies split into 2 time periods, similar to influenza A/H3N2, to account for potential changes in the virus and a potential change in case fatality rates in the post-PCV7 period, as some influenza-associated fatalities are known to be mediated by the pneumococcus (31). Although this had very minor impact on average estimates (Web Table 6), certain seasonal estimates were quite different from the corresponding numbers in the main body of the text. For example, during the 2003–2004 through 2006–2007 seasons, for which data about laboratory-confirmed influenza-associated deaths in children are available (32, 33), our estimates for the number of influenza-associated deaths in children was approximately 4.2 times higher than the number of confirmed deaths; the corresponding ratio is 3.2 for the sensitivity analyses in Web Appendix 2. Such a discrepancy may in part have to do with the imperfection of the model for non–influenza-associated mortality, with a finer separation of influenza incidence proxies aimed at a better assessment of the case fatality rates during different time periods potentially resulting in fitting the difference between true and modeled annual non–influenza-associated mortality by influenza incidence proxies. Another limitation relates to the lack of the CDC surveillance data (Outpatient Influenza-like Illness Surveillance and Viral surveillance) during the off-season weeks (calendar weeks 21–39), so that we had to set influenza incidence to 0 during the off-season periods. Examination of the subtype-specific influenza incidence curves during our study period (Figure 1 in 14) suggests that influenza virus activity tapers off drastically at the beginning and the end of the influenza season periods. Available data during the off-season weeks agrees with that finding, with influenzalike illness levels decreasing noticeably compared with levels from the influenza season period and the percent of symptomatic individuals testing positive for influenza decreasing even further ((34)). Altogether, we believe that out-of-season influenza circulation has a very minor share of the annual influenza incidence and hence excess mortality.
Further limitations stem from the high correlation between the influenza A/H1N1 and B incidence proxies, which results in potentially imprecise estimates for the mortality contribution of these (sub)types. Further, children (particularly girls) had the lowest share of all-cause influenza-associated mortality that could be explained by the underlying causes considered in the present article. Our analysis may have missed nontraditional mortality outcomes that may be triggered by influenza infection in children, such as neurological disorders (35), which should be incorporated into future analyses. In addition, we did not adjust for respiratory syncytial virus circulation, a key contributor to morbidity and mortality in this age group (3, 36), because of a lack of a corresponding incidence proxy that is linearly related to respiratory syncytial virus incidence. At the same time, the effect of the above may be minor, as respiratory syncytial virus circulation is highly periodic and its impact on mortality should be largely accommodated by our flexible model for the non-influenza mortality baseline.
Interestingly, we found a minor but statistically significant effect of influenza on nonintentional injuries among persons 75 years of age or older that could stem from a predisposition to injuries in frail elderly influenza patients or a lack of specificity of our model. Further work in other settings and with different modeling approaches could help confirm or refute a causal relationship between influenza and injuries. Finally, we essentially estimated mortality directly stemming from complications associated with influenza virus infection. Influenza infection may have long-term effects on human health, as suggested by, for example, the alleged benefit of influenza vaccination for reducing adverse cardiac events (37). We hope to explore the long-term association of influenza with mortality in future work.
Estimates of excess mortality associated with influenza stratified by sex, age, and underlying cause of death can serve as useful guidance for targeting specific populations in terms of vaccination and prompt antiviral treatment. In particular, efforts should be intensified to better protect middle-aged and elderly men with underlying heart conditions and middle-aged men with cancer who experience a higher risk of influenza-related mortality than women of the same age. These findings should help promote a framework in which to assess the impact of influenza in the community taking into account biological differences in susceptibility to infection, immune response to infection and vaccination, and the sociobehavioral differences between men and women (38).
Supplementary Material
ACKNOWLEDGMENTS
Author affiliations: Department of Epidemiology, Center for Communicable Disease Dynamics, Harvard School of Public Health, Boston, Massachusetts (Talia M. Quandelacy, Marc Lipsitch, Edward Goldstein); Division of International Epidemiology and Population Studies, Fogarty International Center, National Institutes of Health, Bethesda, Maryland (Cecile Viboud, Vivek Charu); School of Medicine, Johns Hopkins University, Baltimore, Maryland (Vivek Charu); and Department of Immunology and Infectious Disease, Harvard School of Public Health, Boston, Massachusetts (Marc Lipsitch).
This work was supported in part by award number U54GM088558 from the National Institute of General Medical Sciences (Talia M. Quandelacy, Marc Lipsitch, and Edward Goldstein), by the US National Institutes of Health K01 award 1K01AI101010-01 (Edward Goldstein), and by the influenza research program of the Fogarty International Center, National Institutes of Health (Cecile Viboud, Vivek Charu).
We thank Drs. Lyn Finelli and Anne Presanis for helpful discussions.
The content is solely the responsibility of the authors and does not necessarily represent the official views of the National Institute of General Medical Sciences or the National Institutes of Health.
Conflict of interest: Marc Lipsitch has received consulting income from the Avian/Pandemic Flu Registry (Outcome Sciences, funded in part by Roche), Pfizer/Wyeth, and Novartis Vaccines and Diagnostics. The other authors declare no conflicts.
REFERENCES
- 1.Centers for Disease Control and Prevention (CDC) Estimates of deaths associated with seasonal influenza—United States, 1976-2007. MMWR Morb Mortal Wkly Rep. 2010;59(33):1057–1062. [PubMed] [Google Scholar]
- 2.Thompson WW, Weintraub E, Dhankhar P, et al. Estimates of US influenza-associated deaths made using four different methods. Influenza Other Respi Viruses. 2009;3(1):37–49. doi: 10.1111/j.1750-2659.2009.00073.x. [DOI] [PMC free article] [PubMed] [Google Scholar]
- 3.Thompson WW, Shay DK, Weintraub E, et al. Mortality associated with influenza and respiratory syncytial virus in the United States. JAMA. 2003;289(2):179–186. doi: 10.1001/jama.289.2.179. [DOI] [PubMed] [Google Scholar]
- 4.Wu P, Goldstein E, Ho LM, et al. Excess mortality associated with influenza A and B virus in Hong Kong, 1998–2009. J Infect Dis. 2012;206(12):1862–1871. doi: 10.1093/infdis/jis628. [DOI] [PMC free article] [PubMed] [Google Scholar]
- 5.Goldstein E, Viboud C, Charu V, et al. Improving the estimation of influenza-related mortality over a seasonal baseline. Epidemiology. 2012;23(6):829–838. doi: 10.1097/EDE.0b013e31826c2dda. [DOI] [PMC free article] [PubMed] [Google Scholar]
- 6.Simonsen L, Reichert TA, Viboud C, et al. Impact of influenza vaccination on seasonal mortality in the US elderly population. Arch Intern Med. 2005;165(3):265–272. doi: 10.1001/archinte.165.3.265. [DOI] [PubMed] [Google Scholar]
- 7.Klein SL, Passaretti C, Anker M, et al. The impact of sex, gender and pregnancy on 2009 H1N1 disease. Biol Sex Differ. 2010;1(1):5–16. doi: 10.1186/2042-6410-1-5. [DOI] [PMC free article] [PubMed] [Google Scholar]
- 8.Viboud C, Eisenstein J, Reid AH, et al. Age- and sex-specific mortality associated with the 1918–1919 influenza pandemic in Kentucky. J Infect Dis. 2013;207(5):721–729. doi: 10.1093/infdis/jis745. [DOI] [PMC free article] [PubMed] [Google Scholar]
- 9.Jacobs JH, Archer BN, Baker MG, et al. Searching for sharp drops in the incidence of pandemic A/H1N1 influenza by single year of age. PLoS One. 2012;7(8):e42328. doi: 10.1371/journal.pone.0042328. [DOI] [PMC free article] [PubMed] [Google Scholar]
- 10.World Health Organization. Geneva, Switzerland: WHO Press; 2010. Sex, gender, and influenza http://www.who.int/gender/documents/women_and_girls/9789241500111/en/index.html. (Accessed February 1, 2013) [Google Scholar]
- 11.Silver Spring, MD: National Association for Public Health Statistics and Information Systems; 2012. Underlying cause of death https://naphsis-web.sharepoint.com/about/Documents/underlying_cause-.pdf. (Accessed February 1, 2013) [Google Scholar]
- 12.Anderson RN, Minino AM, Hoyert DL, et al. Comparability of cause of death between ICD-9 and ICD-10: preliminary estimates. Natl Vital Stat Rep. 2001;49(2):1–32. [PubMed] [Google Scholar]
- 13.Atlanta, GA: US Centers for Disease Control and Prevention; 2012. United States Surveillance Data: 1997–1998 through 2009–2010 Seasons http://www.cdc.gov/flu/weekly/ussurvdata.htm. (Accessed October 1, 2012) [Google Scholar]
- 14.Goldstein E, Cobey S, Takahashi S, et al. Predicting the epidemic sizes of influenza A/H1N1, A/H3N2, and B: a statistical method. PLoS Med. 2011;8(7):e1001051. doi: 10.1371/journal.pmed.1001051. [DOI] [PMC free article] [PubMed] [Google Scholar]
- 15.Atlanta, GA: US Centers for Disease Control and Prevention; 2013. Overview of Influenza Surveillance in the United States http://www.cdc.gov/flu/weekly/overview.htm. (Accessed February 1, 2013) [Google Scholar]
- 16.Lexau CA, Lynfield R, Danila R, et al. Changing epidemiology of invasive pneumococcal disease among older adults in the era of pediatric pneumococcal conjugate vaccine. JAMA. 2005;294(16):2043–2051. doi: 10.1001/jama.294.16.2043. [DOI] [PubMed] [Google Scholar]
- 17.Whitney CG, Farley MM, Hadler J, et al. Decline in invasive pneumococcal disease after the introduction of protein-polysaccharide conjugate vaccine. NEJM. 2003;348(18):1737–1746. doi: 10.1056/NEJMoa022823. [DOI] [PubMed] [Google Scholar]
- 18.Centers for Disease Control and Prevention (CDC) Direct and indirect effects of routine vaccination of children with 7-valent pneumococcal conjugate vaccine on incidence of invasive pneumococcal disease—United States, 1998–2003. MMWR Morb Mortal Wkly Rep. 2005;54(36):893–897. [PubMed] [Google Scholar]
- 19.Simonsen L, Taylor RJ, Young-Xu Y, et al. Impact of pneumococcal conjugate vaccination of infants on pneumonia and influenza hospitalization and mortality in all age groups in the United States. mBio. 2011;2(1):e00309–e00310. doi: 10.1128/mBio.00309-10. [DOI] [PMC free article] [PubMed] [Google Scholar]
- 20.Walter ND, Taylor TH, Jr, Dowell SF, et al. Holiday spikes in pneumococcal disease among older adults. NEJM. 2009;361(26):2584–2585. doi: 10.1056/NEJMc0904844. [DOI] [PubMed] [Google Scholar]
- 21.Atlanta, GA: US Centers for Disease Control and Prevention; 2012. Antiviral Recommendations Advisory. Health Alert Network http://www.bt.cdc.gov/HAN/han00339.asp. (Accessed March 1, 2013) [Google Scholar]
- 22.Serfling RE. Methods for current statistical analysis of excess pneumonia-influenza deaths. Public Health Rep. 1963;78(6):494–506. [PMC free article] [PubMed] [Google Scholar]
- 23.Dushoff J, Plotkin JB, Viboud C, et al. Mortality due to influenza in the United States–an annualized regression approach using multiple-cause mortality data. Am J Epidemiol. 2006;163(2):181–187. doi: 10.1093/aje/kwj024. [DOI] [PubMed] [Google Scholar]
- 24.Khiabanian H, Farrell GM, St George K, et al. Differences in patient age distribution between influenza A subtypes. PLoS One. 2009;4(8):e6832. doi: 10.1371/journal.pone.0006832. [DOI] [PMC free article] [PubMed] [Google Scholar]
- 25.Warren-Gash C, Bhaskaran K, Hayward A, et al. Circulating influenza virus, climatic factors, and acute myocardial infarction: a time series study in England and Wales and Hong Kong. J Infect Dis. 2011;203(12):1710–1718. doi: 10.1093/infdis/jir171. [DOI] [PMC free article] [PubMed] [Google Scholar]
- 26.Warren-Gash C, Hayward AC, Hemingway H, et al. Influenza infection and risk of acute myocardial infarction in England and Wales: a CALIBER self-controlled case series study. J Infect Dis. 2012;206(11):1652–1659. doi: 10.1093/infdis/jis597. [DOI] [PMC free article] [PubMed] [Google Scholar]
- 27.Keller TT, van der Sluijs KF, de Kruif MD, et al. Effects on coagulation and fibrinolysis induced by influenza in mice with a reduced capacity to generate activated protein C and a deficiency in plasminogen activator inhibitor type 1. Circ Res. 2006;99(11):1261–1269. doi: 10.1161/01.RES.0000250834.29108.1a. [DOI] [PubMed] [Google Scholar]
- 28.Szretter KJ, Gangappa S, Lu X, et al. Role of host cytokine responses in the pathogenesis of avian H5N1 influenza viruses in mice. J Virol. 2007;81(6):2736–2744. doi: 10.1128/JVI.02336-06. [DOI] [PMC free article] [PubMed] [Google Scholar]
- 29.Epstein SE, Zhou YF, Zhu J. Infection and atherosclerosis: emerging mechanistic paradigms. Circulation. 1999;100(4):e20–e28. doi: 10.1161/01.cir.100.4.e20. [DOI] [PubMed] [Google Scholar]
- 30.Sytkowski PA, D'Agostino RB, Belanger A, et al. Sex and time trends in cardiovascular disease incidence and mortality: the Framingham Heart Study, 1950–1989. Am J Epidemiol. 1996;143(4):338–350. doi: 10.1093/oxfordjournals.aje.a008748. [DOI] [PubMed] [Google Scholar]
- 31.McCullers JA. Insights into the interaction between influenza virus and pneumococcus. Clin Microbiol Rev. 2006;19(3):571–582. doi: 10.1128/CMR.00058-05. [DOI] [PMC free article] [PubMed] [Google Scholar]
- 32.Finelli L, Fiore A, Dhara R, et al. Influenza-associated pediatric mortality in the United States: increase of Staphylococcus aureus coinfection. Pediatrics. 2008;122(4):805–811. doi: 10.1542/peds.2008-1336. [DOI] [PubMed] [Google Scholar]
- 33.Bhat N, Wright JG, Broder KR, et al. Influenza-associated deaths among children in the United States, 2003–2004. NEJM. 2005;353(24):2559–2567. doi: 10.1056/NEJMoa051721. [DOI] [PubMed] [Google Scholar]
- 34.Atlanta, GA: US Centers for Disease Control and Prevention; 2008. 2007–08 US influenza season summary http://www.cdc.gov/flu/weekly/weeklyarchives2007-2008/07-08summary.htm. (Accessed February 1, 2013) [Google Scholar]
- 35.Blanton L, Peacock G, Cox C, et al. Neurologic disorders among pediatric deaths associated with the 2009 pandemic influenza. Pediatrics. 2012;130(3):390–396. doi: 10.1542/peds.2011-3343. [DOI] [PMC free article] [PubMed] [Google Scholar]
- 36.Zhou H, Thompson WW, Viboud CG, et al. Hospitalizations associated with influenza and respiratory syncytial virus in the United States, 1993–2008. Clin Infect Dis. 2012;54(10):1427–1436. doi: 10.1093/cid/cis211. [DOI] [PMC free article] [PubMed] [Google Scholar]
- 37.Loomba RS, Aggarwal S, Shah PH, et al. Influenza vaccination and cardiovascular morbidity and mortality: analysis of 292,383 patients. J Cardiovasc Pharmacol Ther. 2012;17(3):277–283. doi: 10.1177/1074248411429965. [DOI] [PubMed] [Google Scholar]
- 38.Klein SL, Hodgson A, Robinson DP. Mechanisms of sex disparities in influenza pathogenesis. J Leukoc Biol. 2012;92(1):67–73. doi: 10.1189/jlb.0811427. [DOI] [PMC free article] [PubMed] [Google Scholar]
Associated Data
This section collects any data citations, data availability statements, or supplementary materials included in this article.