

Abstract
Online misinformation is a pervasive global problem. In response, psychologists have recently explored the theory of psychological inoculation: If people are preemptively exposed to a weakened version of a misinformation technique, they can build up cognitive resistance. This study addresses two unanswered methodological questions about a widely adopted online “fake news” inoculation game, Bad News. First, research in this area has often looked at pre- and post-intervention difference scores for the same items, which may imply that any observed effects are specific to the survey items themselves (item effects). Second, it is possible that using a pretest influences the outcome variable of interest, or that the pretest may interact with the intervention (testing effects). We investigate both item and testing effects in two online studies (total N = 2,159) using the Bad News game. For the item effect, we examine if inoculation effects are still observed when different items are used in the pre- and posttest. To examine the testing effect, we use a Solomon’s Three Group Design. We find that inoculation interventions are somewhat influenced by item effects, and not by testing effects. We show that inoculation interventions are effective at improving people’s ability to spot misinformation techniques and that the Bad News game does not make people more skeptical of real news. We discuss the larger relevance of these findings for evaluating real-world psychological interventions.
Keywords: misinformation, fake news, inoculation theory, Solomon’s Three Group Design, Bad News
Introduction
The spread of online misinformation is a threat to democracy and a pervasive global problem that is proving to be tenacious and difficult to eradicate (Lewandowsky et al., 2017; van der Linden & Roozenbeek, 2020; World Economic Forum, 2018). Part of the reason for this tenacity can be found in the complexity of the problem: Misinformation is not merely information that is provably false, as this classification would unjustly target harmless content such as satirical articles. Misinformation also includes information that is manipulative or otherwise harmful, for example, through misrepresentation, leaving out important elements of a story, or deliberately fuelling intergroup conflict by exploiting societal or political wedge issues, without necessarily having to be blatantly “fake” (Roozenbeek & van der Linden, 2018, 2019; Tandoc et al., 2018). Efforts to combat misinformation have included introducing or changing legislation (Human Rights Watch, 2018), implementing detection algorithms (Ozbay & Alatas, 2020), promoting fact-checking and “debunking” (Nyhan & Reifler, 2012), and developing educational programs such as media or digital literacy (Carlsson, 2019). Each of these solutions have advantages as well as important disadvantages, such as issues surrounding freedom of speech and expression (Ermert, 2018; Human Rights Watch, 2018), the disproportionate consequences of wrongly labeling or deleting content (Hao, 2018; Pennycook et al., 2020; Pieters, 2018), the limited reach and effectiveness of media literacy interventions (Guess et al., 2019; Livingstone, 2018), the “continued influence effect” of misinformation once it has taken hold in memory (Lewandowsky et al., 2012), and the fact that misinformation may spread further, faster, and deeper on social media than other types of news, thus, ensuring that fact-checking efforts are likely to remain behind the curve (Vosoughi et al., 2018).
Accordingly, researchers have increasingly attempted to leverage basic insights from social and educational psychology to find new and preemptive solutions to the problem of online misinformation (Fazio, 2020; Roozenbeek et al., 2020). One promising avenue in this regard is inoculation theory (Compton, 2012; McGuire, 1964; McGuire & Papageorgis, 1961a; van der Linden, Leiserowitz, et al., 2017; van der Linden, Maibach, et al., 2017), often referred to as the “grandfather of resistance to persuasion” (Eagly & Chaiken, 1993, p. 561). Inoculation theory posits that it is possible to build cognitive resistance against future persuasion attempts by preemptively introducing a weakened version of a particular argument, much like a “real” vaccine confers resistance against a pathogen (Compton, 2019; McGuire & Papageorgis, 1961b). Although meta-analyses have supported the efficacy of inoculation interventions (Banas & Rains, 2010), only recently has research begun testing inoculation theory in the context of misinformation (Cook et al., 2017; Roozenbeek and van der Linden, 2018).
A notable example of a real-world inoculation intervention against online misinformation is the award-winning Bad News game (see Figure 1),1 an online browser game in which players take on the role of a fake news creator and actively generate their own content. The game simulates a social media feed and players see short texts or images, and can react to them in a variety of ways (Figure 1). Their goal is to acquire as many followers as possible while also building credibility for their fake news platform. Through humor (Compton, 2018) and perspective-taking, players are warned and exposed to severely weakened doses of common misinformation techniques in a controlled learning environment in an attempt to help confer broad-spectrum immunity against future misinformation attacks.2
Figure 1.
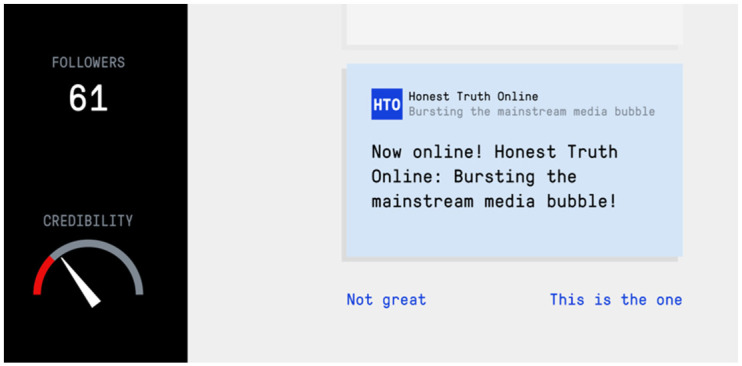
A screenshot of the in-game interface people interact with when playing Bad News.
Although several studies have shown that the Bad News game can successfully improve players’ ability to spot misinformation techniques (e.g., Basol et al., 2020; Roozenbeek & van der Linden, 2019), including cross-cultural evaluations (Roozenbeek et al., 2020),3 several key open questions about how to measure the effectiveness of game-based inoculation interventions remain unanswered. Specifically, the effectiveness of Bad News has so far been assessed by looking at pre–post differences (within-subject) and difference-in-difference scores between groups (i.e., the Bad News game vs. a control task) in which the items (in the form of “fake” and “real” Twitter posts) used for the pretest and posttest are the same.4 However, presenting the same items twice (in the pre- and posttest) may indicate a learning effect specific to the items themselves, rather than participants’ latent ability to spot misinformation in headlines that they have never seen before (i.e., an “item effect”).
Moreover, by simply assessing a construct (i.e., a pretest), researchers may inadvertently influence the outcome variable of interest, or the initial assessment may interact with the intervention and moderate its influence (Song & Ward, 2015). Statistician Andrew Gelman refers to this potential issue as “poisoning the well” (Gelman, 2017). For example by taking a practice test (i.e., a pretest) students may memorize some answers to questions, directly influencing the outcome variable at a second assessment (i.e., a posttest). Additionally, once pretested, the same students may also become more or less comfortable with the testing process, which in turn may moderate the influence of an intervention aimed at improving their scores (i.e., a “testing effect”).
Accordingly, this study addresses both item and testing effects in the context of a real-world intervention. Specifically, we examine if the use of a pretest influences the effects of inoculation against misinformation in two ways. First, to investigate the item effect, we examine if inoculation effects are still observed when different items are used in the pre- and posttest. To examine the testing effect, we use a Solomon’s Three Group Design (Solomon, 1949), in which participants are randomly assigned to one of three groups. Group 1 can be considered a traditional experimental group with a pretest, intervention (the Bad News game), and a posttest. Group 2 participates in a pretest and posttest, without an intervention (the control group). Finally, Group 3 receives the intervention and the posttest, but no pretest. This allows us to isolate the unique influence of the pretest, intervention, and interaction of the pretest and intervention (pretest × intervention) on the mean difference score between pre- and posttest.
Experimental Design
We present the results of two separate preregistered5 experiments. Following the approach laid out by Roozenbeek and van der Linden (2019), we implemented voluntary in-game surveys both at the start and at the end of the Bad News game. After being introduced to the game mechanics, players of the game were asked to participate in a scientific study. If players provided informed consent, we recorded their responses to a series of pre–post test items (in the form of “fake” or “real” Twitter posts) as well as several demographic questions (see the “Outcome Measures” section for more details). The studies were approved by the Psychology Research Ethics Committee Ethics Committee, and both experiments were run within the game over a period of 6 months (from June 30, 2019 to December 17, 2019). The full R scripts and datasets are available via the OSF: https://doi.org/10.17605/OSF.IO/FGEQJ.
As this study uses an intervention (the Bad News game) that (1) is an online experiment with consistent measurements and instruments, (2) is short in duration (the game takes about 15 minutes to complete), (3) relies on relatively large sample sizes (N1 = 480, N2 = 1,679), and (4) ensures that all participants are randomly assigned a condition, traditional threats to internal validity such as history effects, maturation effects, instrumentation effects, regression to the mean, participant selection bias,6 and systematic attrition are minimized.
Experiment 1: Item Effect
In Experiment 1, to investigate the item effect, two different sets, each consisting of six fake (one per misinformation technique) and two “real” (control) items (a total of eight items per set) were used, which we will call Set A and Set B. Supplementary Table S1 (available online) provides a full overview of both item sets. After a series of demographic questions, we randomly presented participants with either Set A or Set B in the pretest. In the posttest after gameplay, participants who had seen Set A in the pretest were shown Set B in the posttest, and vice versa. If there is no item effect, participants should rate tweets containing misinformation as significantly less reliable after gameplay, even if the pretest and posttest items are different. This leads to the following hypotheses (see also Figure 2 and Table 1):
Figure 2.

Flowchart with hypotheses for the Item Effects experiment.
Table 1.
Experimental Setup.
| Experiment | Condition | Solomon | Demographics first | Pretest | Intervention | Posttest |
|---|---|---|---|---|---|---|
| Item effect | A–B | Yes | Set A | Bad News | Set B | |
| B–A | Yes | Set B | Bad News | Set A | ||
| Testing effect | Pre–post | Group 1 (E1) | Yes | Set A | Bad News | Set A |
| Controla | Group 2 (C1) | No | Set A | Demographics | Set A | |
| Post only | Group 3 (E2) | Yes | — | Bad News | Set A |
Six out of eight items were different in the control group as compared with the other two groups in this experiment; see Note 9.
To test if the inoculation effect remains intact:
Hypothesis 1: When comparing an index of the same items, pretest (group x) with posttest (group y), there is a decrease in the perceived reliability of misinformation, but not for real news. [Hypothesis 1a]: Set A–A. [Hypothesis 1b]: Set B–B.
Hypothesis 2: When comparing an index of different items, pretest (group x) with posttest (group x), there is a decrease in perceived reliability of misinformation, but not for real news. [Hypothesis 2a]: Set A–B. [Hypothesis 2b]: Set B–A.
To test if the inoculation effect changes:
Hypothesis 3: There are no significant difference-in-difference changes in perceived reliability of news items between Set A–B and Set B–A.
Experiment 2: Testing Effect
Experiment 2 investigated the testing effect using three different in-game surveys (in line with Solomon’s Three Group Design)7: (1) a standard experimental group which first answered demographic questions, then did a pretest, then played the Bad News game, and then did a posttest (Group 1)8; (2) a traditional control group (without an intervention) in which participants were shown a pretest, then answered a series of demographic questions, and were then shown a posttest, after which they continued with the remainder of the Bad News game (Group 2); and (3) a posttest-only group, which first answered demographic questions (without a pretest), then played the Bad News game, and then did a posttest (Group 3).9 If there is no testing effect, the inoculation effect should be the same when a pretest is administered compared with no pretest (i.e., when comparing Group 1 with Group 3). This leads to the following hypotheses (see Figure 3 and Table 1):
Figure 3.

Flowchart with hypotheses for the Testing Effects experiment.
To test the total effect:
Hypothesis 1: A total effect is observed when comparing mean pretest perceived reliability ratings with mean posttest reliability ratings in the standard experimental group (Group 1).
To test the pretest effect:
Hypothesis 2: No effect is observed when comparing the mean pretest perceived reliability rating with the mean posttest reliability rating in the control group (Group 2).
To test if the pretest interacts with the intervention:
Hypothesis 3: There is no significant difference between the mean posttest reliability rating of Group 1 subtracted by the pretest effect and the mean posttest reliability ratings in the posttest-only experimental group (Group 3).
To test the corrected inoculation effect:
Hypothesis 4: There is a significant difference between the difference in fake news reliability ratings of the pretest and the posttest in Group 1, when the pretest effect and the interaction effect are subtracted from the posttest mean, but not for real news.
To confirm the inoculation effect through alternative analysis:
Hypothesis 5: An inoculation effect is observed when comparing the mean pretest reliability rating of Group 1 with the mean posttest reliability rating in Group 3.
Participants
Prior power analysis for the detection of effect sizes of d = −0.30 (based on Roozenbeek & van der Linden, 2019) with a Bonferroni corrected α of .01, indicated that for each study we needed 536 participants per group (two groups for Experiment 1, three groups for Experiment 2) for a power of .99. In total, we collected 36,966 responses from participants who started the study in the Bad News game.10 After removing duplicate cases and filtering on complete cases only, 2,182 unique participants remained who completed the full experiment (480 for Experiment 1 and 1,679 for Experiment 2). Due to two back-end technical errors, data had to be recollected for Experiment 1. The first two data collection attempts (N1 = 2,408, N2 = 1,532) were unsuccessful due to errors in the implementation of the survey; specifically, the first attempt did not include the polarization item, and the second attempt contained the same polarization item in both Set A and Set B. All technical errors were eventually fixed, allowing for successful data collection, albeit smaller in sample size as a result of collection limitations. Supplementary Table S4 shows the full results in detail.
The final sample consisted of 51% men, 59% of participants were between the ages of 18 and 29 years, 57% identified as liberal (1-7 Likert-type scale), and 48% indicated having completed higher education. In addition, 76% of participants used social media regularly or daily; 60% indicated they use Twitter; and 78% checked the news either regularly or every day. A full overview of the sample demographics can be found in Supplementary Table S2.
Outcome Measures
As mentioned above, two sets of Twitter posts were designed (Set A and Set B). Each set of items contained a total of eight Twitter posts: two “real” (control) tweets (that do not contain any misinformation technique; e.g., President Trump wants to build a wall between the US and Mexico), and six “fake” tweets that contain misinformation (one for each technique; e.g., The Bitcoin exchange rate is being manipulated by a small group of rich bankers #InvestigateNow for the “conspiracy” technique; see Roozenbeek & van der Linden, 2019 for a more detailed description). The six misinformation techniques used in these tweets are impersonation, using emotional language, increasing group polarization, conspiracist ideation, discrediting opponents, and trolling (Basol et al., 2020; Roozenbeek et al., 2020; Roozenbeek & van der Linden, 2019). The items were designed to be balanced as well as realistic, but not “real” in the sense that they constitute real-life examples of fake (verifiably false) news. Following Roozenbeek and van der Linden (2019), we chose this approach (rather than using real-life examples of fake news) for several reasons: (1) to avoid memory confounds (e.g., people may have seen a fake news story before), (2) to better be able to isolate each misinformation technique, (3) to balance the items for political neutrality, and (4) to avoid using only “fake” information so as to also include other manipulation techniques (without being explicitly false). To give an example: The two items making use of the “polarization” technique are Clear difference in career success between left-wing and right-wing voters #Promotion (Set A) and The myth of equal IQ between left-wing and right-wing people exposed #TruthMatters (Set B). Supplementary Table S1 contains the full list of items.
The primary dependent measure in both studies was participants’ ability to recognize misleading content in the form of simulated Twitter posts that made use of one (or none in the case of a control item) of the six misinformation techniques learned in Bad News. To meet this aim, participants were asked to rate the reliability of each Twitter post on a 7-point Likert-type scale (see Figure 4 for a typical example).11
Figure 4.
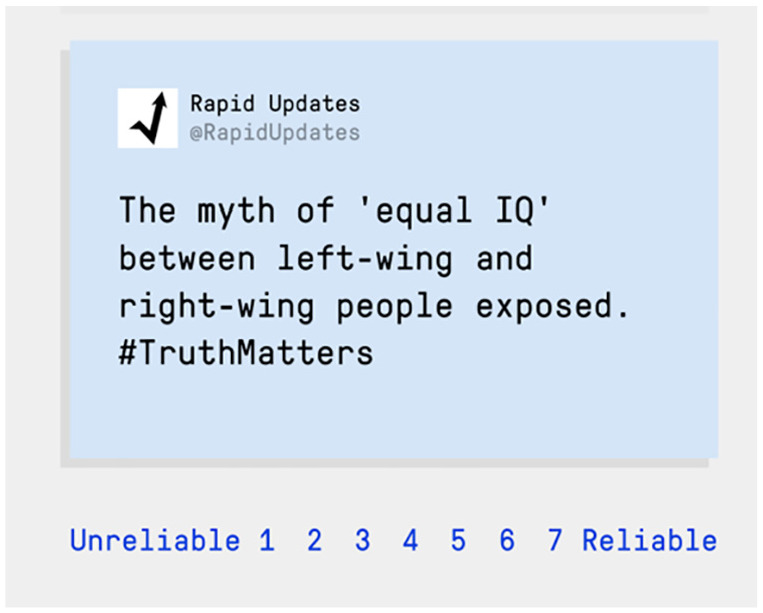
Example item.
Results
Experiment 1: Item Effects12
Fake News
In Experiment 1, we investigated whether the use of different item sets, compared with using the same items for the pretest and posttest, influences the inoculation effect. Participants had to rate the reliability of each item (Mfake,SetA = 2.73, SD = 1.26, Cronbach’s α = .74; Mfake,SetB = 2.60, SD = 1.10, Cronbach’s α = .65). Descriptively, we found a decrease in reliability from pretest to posttest for both groups (Mdiff,GroupAB = −0.22, SEdiff,GroupAB = 0.07; Mdiff,GroupBA = −0.35, SEdiff,GroupBA = 0.08), which may also be represented as a shift of the distribution (see density plots in Figure 5, Panel B). However, descriptive and visual analyses also suggest an unequal starting point for the different item sets (Mpre,SetA = 2.73, SDpre,SetA = 1.26; Mpre,SetB = 2.60, SDpre,SetB = 1.10), and a differential effectiveness for each item set (Mdiff,SetA = −0.49, SEdiff,SetA = 0.11; Mdiff,SetB = −0.08, SEdiff,SetB = 0.12).13Figure 5 shows a visualization of the results.
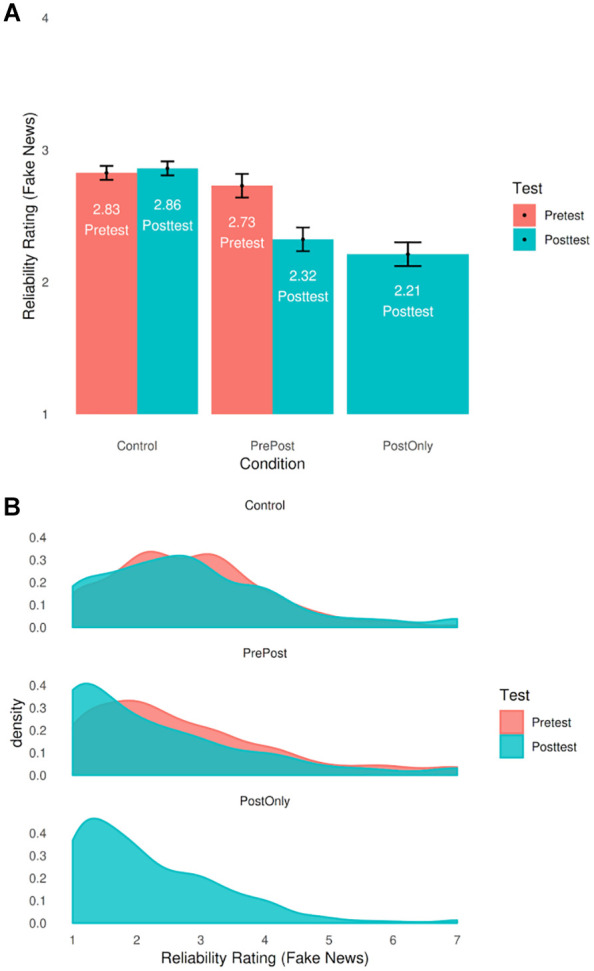
Figure 5.

Bar chart (A) and density plots (B) of fake news reliability ratings in the Item Effects study.
Note. N = 480. Error bars represent 95% confidence intervals. For a reversed plotting, where grouping is organized per set rather than per group, see Supplementary Figure S3.
To put this to hypothesis testing, we performed five tests, accounting for multiple testing using a Bonferroni correction (α = .05/5 tests = .01). We first looked at the hypothesis tests investigating whether we still find an inoculation effect using the new procedure of crossing item sets. We tested if the inoculation effect persists when crossing the items between groups, in order to compare Set A (B) pretest measures with Set A (B) posttest measures. We found a significant effect for Set A (pretest Group 1) versus Set A (posttest Group 2) [Hypothesis 1a] (Mdiff = −0.49, 95% confidence interval CIM = [−0.70, −0.27], t(474) = −4.39, p < .001, d = −0.401, 95% CId = [−0.583, −0.218]), but no significant difference for Set B (pretest Group 2) versus Set B (posttest Group 1) [Hypothesis 1b] (Mdiff = −0.08, 95% CIM = [−0.31, 0.14], t(447) = −0.72, p = .47, d = −0.066, 95% CId = [−0.245, 0.113]). To investigate whether this equals the absence of any effect of interest (Lakens et al., 2018, 2020), we conducted an equivalence test using two one-sided tests (TOSTs).14 We confirmed statistical equivalence to zero for Set B − Set B, t(447) = 2.57, p = .005, with the smallest effect size of interest (SESOI) as d = (−)0.30 and α = .01, in line with our preregistered effect size. Next, we looked at whether an inoculation effect can be detected across the two item sets within the same group (pre vs. post), and found a significant difference within groups for both Group 1 from Set A (pre) to Set B (post) [Hypothesis 2a] (Mdiff = −0.21, 95% CIM = [−0.36, −0.07], t(238) = −3.00, p = .003, d = −0.194, 95% CId = [−0.322, −0.066]), as well as for Group 2 from Set B (pre) to Set A (post) [Hypothesis 2b] (Mdiff = −0.35, 95% CIM = [−0.51, −0.20], t(240) = −4.46, p < .001, d = −0.287, 95% CId = [−0.416, −0.158]). Finally, we looked at whether the inoculation effect changes depending on the item sets used when comparing differences-in-differences, and found no significant difference [Hypothesis 3] (Mdiff-in-diffs = −0.14, 95% CIM = [−0.35, 0.07], t(474) = −1.28, p = .20, d = −0.117, 95% CId = [−0.296, 0.062]). However, a TOST equivalence test could not confirm statistical equivalence to zero, t(474) = 2.01, p = .023.
Since for Hypotheses 2 and 3 different item sets were compared without standardization, we also performed the same test using z-scores based on the means and standard deviations of the pretest scores for each set.15 We found—in contrast to the nonstandardized test—no significant effect for Set A–B [Hypothesis 2a], t(238) = −1.20, p = .23, d = −0.078, 95% CId = [−0.204, 0.049], with statistical equivalence indicating the absence of an effect of interest, t(238) = 3.44, p < .001. However, the difference between Set B and Set A remained significant [Hypotheis 2b], t(240) = −5.71, p < .001, d = −0.368, 95% CId = [−0.498, −0.237]. This in turn led to a significant difference-in-differences test [Hypothesis 3], t(476) = −3.34, p < .001, d = −0.305, 95% CId = [−0.485, −0.124]. See Supplementary Figure S6 for a visual plotting of the standardized scores. Figure 6 shows the results of the hypothesis tests.
Figure 6.

Procedure flowchart with hypothesis tests in the Item Effects experiment (N = 480).
We thus find partial support for our preregistered hypotheses. Our analyses indicate that the inoculation effect does not always persist in different circumstances with varying items, as the strength of the effect is influenced by the psychometric properties of the news items used and the order of the item sets. Comparing Set B (pretest) with Set B (posttest) not only showed no significant effect, but the equivalence test also indicated absence of an effect with d = (−)0.30. This suggests that Set B did not yield the inoculation benefit across groups while Set A did. When standardizing the different item sets before comparison (to eliminate confounds with item properties), we no longer find a significant effect for Item Set A (pretest) compared with Set B (posttest). This suggests that on top of differential effects depending on the item properties, order effects are present as well.
Real News
As preregistered, we also report our findings for the real news items. We found that, due to the low item count, the real news indices did not yield an acceptable internal consistency (Mreal,SetA = 4.50, SD = 1.32, Cronbach’s α = .14; Mreal,SetB = 5.08, SD = 1.41, Cronbach’s α = .43). It is therefore not a sufficient measure to come to generalizable conclusions regarding item effects, in contrast to the fake news indices (which show an acceptable internal consistency for both item sets).
Nonetheless, using the unstandardized sets, we found no significant effect for Set A (pretest Group 1) versus Set A (posttest Group 2) [Hypothesis 1a] (Mdiff = −0.16, 95% CIM = [−0.39, 0.06], t(472) = −1.43, p = .15, d = −0.131, 95% CId = [−0.310, 0.049]), but could not confirm statistical equivalence to zero, t(472) = 1.85, p = .032. No significant difference was found for Set B (pretest Group 2) versus Set B (posttest Group 1) [Hypothesis 1b] (Mdiff = 0.01, 95% CIM = [−0.26, 0.28], t(470) = 0.05, p = .96, d = 0.005, 95% CId = [−0.174, 0.184]), and we were able to confirm statistical equivalence to zero, t(470) = −3.24, p < .001. Looking at the two item sets presented in the same group (pre vs. post), we found a significant difference within groups both for both Group 1 from Set A (pre) to Set B (post) [Hypothesis 2a] (Mdiff = 0.59, 95% CIM = [0.37, 0.80], t(238) = 5.38, p < .001, d = 0.348, 95% CId = [0.217, 0.478]), and for Group 2 from Set B (pre) to Set A (post) [Hypothesis 2b] (Mdiff = −0.74, 95% CIM = [−0.95, −0.54], t(240) = −7.10, p < .001, d = −0.457, 95% CId = [−0.589, −0.324]). These effects were in the opposite direction of each other and therefore point toward item effects rather than inoculation effects (i.e., these effects can be best explained by differences in item-set baseline scores, see standardized analyses below). To see if there are differences in these item effects, we looked at changes using the difference-in-differences, and found a significant effect [Hypothesis 3] (Mdiff-in-diffs = −1.33, 95% CIM = [−1.63, −1.03], t(477) = −8.80, p < .001, d = −0.803, 95% CId = [−0.995, −0.610]).
As with the fake news items, we compared the z-score standardized sets, and found no significant effect for [Hypothesis 2a], t(238) = 0.06, p = .95, d = 0.004, 95% CId = [−0.123, 0.131], and TOST statistical equivalence to zero, t(759) = −8.16, p < .001. We also found no significant effect for [Hypothesis 2b], t(240) = −1.62, p = .11, d = −0.105, 95% CId = [−0.231, 0.022]), and equivalence to zero, t(759) = 5.38, p < .001. This was further corroborated by a nonsignificant difference-in-differences test [Hypothesis 3], t(477) = −1.17, p < .241, d = −0.107, 95% CId = [−0.286, 0.072]. See Supplementary Figure S6 for a visual plotting of the standardized scores.
These results provide evidence for all our preregistered hypotheses with respect to real news items (Hypotheses 1-3). First, we found, as expected, no inoculation effect for the real news items (i.e., intervention does not increase general skepticism for real news, but only for fake news; Hypotheses 1a and 1b). Equivalence testing confirmed the absence of any effect of interest. Second, we unexpectedly found item effects when comparing the different item sets across groups (Hypotheses 2a and 2b), but these effects were eliminated after standardizing the scale. These findings indicate the absence of a negative inoculation effect for real news items. Raw means, standard deviations, and visuals analyses for the real news scale can be found in Supplementary Table S3 and Supplementary Figures S1 and S3.
Experiment 2: Testing Effects16
Fake News
In Experiment 2, we investigated the testing effect.17 Using Solomon’s Three Group analysis,18 we executed five hypothesis tests with a Bonferroni corrected α = .01 (.05/5 tests) threshold for ratings of the reliability of the various news items (Mfake,PrePost = 2.73, SD = 1.47, Cronbach’s α = .81; Mfake,Control = 2.83, SD = 1.18, Cronbach’s α = .66). First, to measure the total effect, we looked at the standard pretest—inoculation—posttest group (henceforth referred to as Group 1), and found a significant effect, measured by looking at the difference in mean posttest reliability rating compared with the pretest, in line with our hypothesis [Hypothesis 1] (Mdiff = −0.41, 95% CIM = [−0.53, −0.29], t(312) = −6.30, p < .001, d = −0.356, 95% CId = [−0.470, −0.242]). This indicates a small total effect, but on its own does not show whether this effect is found due to the success of inoculation or due to design effects. To look at potential effects solely due to pretesting, we looked at the same difference score within the control group (Group 2), and found a trivial and nonsignificant effect, as hypothesized [Hypothesis 2] (Mdiff = 0.03, 95% CIM = [−0.04, 0.11], t(759) = 0.89, p = .37, d = 0.032, 95% CId = [−0.039, 0.103]) that is statistically equivalent to zero, t(759) = −7.38, p < .001. See Figure 7 for a visual overview.
Figure 7.
Bar chart (A) and density plots (B) of fake news reliability ratings in the Testing Effects study.
Note. N = 1,679. Error bars represent 95% confidence intervals.
Next, to investigate the interaction effect between the pretest and the intervention, we looked at whether the posttest mean of Group 1, subtracted by the pretest effect is different from the posttest mean of the posttest-only group (Group 3). As hypothesized, we found a positive but nonsignificant interaction effect [Hypothesis 3] (Mdiff = 0.08, 95% CIM = [−0.11, 0.27], t(503) = 0.82, p = .41, d = 0.060, 95% CId = [−0.077, 0.196]), statistically equivalent to zero, t(502) = −3.31, p < .001. Finally, we subtracted the pretest effect and interaction effect from the posttest mean in Group 1, and then looked at the pre–post difference score. We found a significant inoculation effect [Hypothesis 4] (Mdiff = −0.52, 95% CIM = [−0.65, −0.39], t(312) = −8.05, p < .001, d = −0.455, 95% CId = [−0.571, −0.338]), in line with our hypothesis. Finally, to confirm our Solomon analysis in an alternative test, which is feasible because of the high sample size, we looked at the difference between the posttest mean in Group 3 in comparison to the pretest mean in Group 1, and found a significant effect similar to the one found with the traditional analysis (as hypothesized) [Hypothesis 5] (Mdiff = −0.52, 95% CIM = [−0.71, −0.33], t(506) = −5.47, p < .001, d = −0.396, 95% CId = [−0.534, −0.258]). These hypothesis tests indicate that the inoculation effect is not affected by the administration of a pretest or a pretest × intervention interaction, and that even if there would be a testing effect, it is a small one that does not amplify but slightly decreases the inoculation effect. See Figure 8 for a flowchart with indicated results of our hypothesis tests.
Figure 8.

Procedure flowchart with hypothesis tests in the Testing Effects experiment (N = 1,679).
Real News
For Experiment 2, we again found low internal consistency for the real news items (Mreal,PrePost = 4.18, SD = 1.57, Cronbach’s α = .39; Mreal,Control = 5.17, SD = 1.58, Cronbach’s α = .43). As in Experiment 1, this is most likely due to the low number of real news items (2) used in our study, as the fake news items (6) do show acceptable internal consistency. Therefore, the two real news items are not a sufficient measure to come to generalizable conclusions regarding testing effects with regards to real news.
Nonetheless, we first looked at the overall effect, and found a negative effect [Hypothesis 1] (Mdiff = −0.39, 95% CIM = [−0.58, −0.20], t(312) = −3.95, p < .001, d = −0.223, 95% CId = [−0.335, −0.111]), indicating an unexpected decrease in reliability rating for real news items, not in line with our hypothesis. We found no significant pretest effect that could explain this [Hypothesis 2] (Mdiff = −0.10, 95% CIM = [−0.20, −0.01], t(759) = −2.09, p = .04, d = −0.076, 95% CId = [−0.147, −0.005]), and were able to confirm statistical equivalence to zero, t(759) = 6.18, p < .001. We did find an interaction effect between the pretest and the intervention [Hypothesis 3] (Mdiff = −0.31, 95% CIM = [−0.55, −0.08], t(522) = −2.62, p = .009, d = −0.188, 95% CId = [−0.325, −0.051]). We did not find a pure inoculation effect (i.e., the inoculation effect when subtracting pretesting effects and item set × intervention interaction effects) for real news [Hypothesis 4] (Mdiff = 0.03, 95% CIM = [−0.17, 0.22], t(312) = 0.27, p = .79, d = 0.015, 95% CId = [−0.096, 0.126]). Statistical equivalence confirmed to zero, t(609) = −3.56, p < .001, indicating that the observed decreased reliability rating was due to the interaction and not due to a generalized negative influence of the intervention. Our final hypothesis test, which compared the posttest in the Intervention-Post group with the pretest of the Pre-intervention-Post group, further corroborated evidence for the absence of a negative inoculation effect [Hypothesis 5] (Mdiff = 0.03, 95% CIM = [−0.18, 0.24], t(596) = 0.25, p = .80, d = 0.018, 95% CId = [−0.119, 0.154]), with statistical equivalence equal to zero, t(596) = −4.02, p < .001.
The overall effect indicated a negative impact of the intervention, which on the surface could be interpreted as an increase in skepticism toward real as well as fake news. However, the pure inoculation effect (total effect minus the pretest and pretest-intervention interaction effects) was not only insignificant, but any effect of interest was absent. As a significant interaction was found between pretest and intervention (a pretest effect was absent), these results suggest that while negative effects can be expected when using the intervention with real news items in pre–post designs, these effects are due to an interaction with the specific item set and not due to a negative inoculation effect of the intervention itself. We can thus confirm our hypotheses for the real news items. Raw means, standard deviations, and visuals analyses for the real news items can be found in Supplementary Table S5, and Supplementary Figures S4 and S5.
Discussion and Conclusion
The common procedure has been to give a group a pre-test, using an acceptable attitude scale, then subject the group to educational procedures of some sort, and then post-test the group with the same test or an equivalent form of it. (Richard Solomon, 1949, p. 139)
The procedure outlined by Solomon in 1949 is still used today, for example, in evaluating fake news interventions (Roozenbeek & van der Linden, 2019). Because large within-designs allow for greater measurement precision than noisy small sample between-designs, Gelman (2017) suggests that psychologists should routinely use them. Yet do within-designs “poison the well”? This study has addressed two major open methodological questions about the effectiveness of inoculation interventions in the context of online misinformation. First, we found that using different testing item sets for pre- and postintervention scores we do not always find significant reductions with our preregistered SESOI of d = −0.30. We found two types of item effects to be present: item set order effects and differences in psychometric properties between the item sets. Comparing Set B (pretest) with Set B (posttest) across groups, for example, did not yield any effect of interest, indicating a potential validity problem. Comparing item Set A with item Set B yielded different results than comparing Set B with Set A, indicating order effects. This finding may be explained by an overestimation on our part of the effect size, and basing our power and SESOI on a more potent item set. We refer here to Supplementary Table S4: comparing Set A (pre) with Set B (post) gives an effect size of d = −0.39 (CI = [−0.45, −0.33]), which is higher than the preregistered d = 0.30, whereas comparing Set B (pre) with Set B (post) gives d = −0.23 (CI = [−0.29, −0.17]). This indicates that the effect size differs from set to set, and that the preregistered value of d = 0.30 was too optimistic for Set B. Nonetheless, d = 0.23 (which would have yielded no statistical equivalence to zero) is considered a meaningful effect size for interventions in persuasion research (Funder & Ozer, 2019). To summarize, we find that inoculation still occurs when using different items in the pre- and posttest. However, when doing so, we do find some item effects.
The raw differences between pre- and postscores, moreover, were consistently in the right direction (see Figure 5): Participants systematically gave lower average reliability ratings to fake news after the intervention. In the case of real news, we only found differences in starting values. After standardizing the sets to be able to compare them without the confound of differential item properties, differences in the perceived reliability of real news before and after playing the Bad News game disappeared. This points toward the importance of item design and compatibility of the different real news headlines.
Combined, these results suggest that people who play the Bad News game indeed show improvement in their latent ability to spot misinformation techniques, as opposed to merely improving their ability to do so in examples of misinformation that they had already seen before (in the pretest). However, the experiment also shows that the sets of items used and the order in which they are presented can make a difference for the effect size. Future research as well as practitioners should take this into account. One way to do this is to aim toward the development of better psychometrically validated and equalized item sets that combine real and fake news items that ideally could be used for a wide range of misinformation interventions.
Second, using Solomon’s Three Group Design, we demonstrate that testing effects in inoculation interventions are minimal. If there is any effect at all, it is small and in the opposite direction than expected: Participants who do not go through a pretest (Group 3) perform better at spotting misinformation and discerning real news from fake news after playing Bad News than participants who take both a pretest and a posttest (Group 1). The Solomon analysis suggests that if there is an effect, this would be due to interaction effects between the pretest and the intervention. That is, there is something about the way the pretest interacts with the intervention that ultimately reduces its effectiveness. This suggests that researchers and practitioners can consider omitting the pretest for large-sample mixed-design (pretest vs. posttest and control vs. treatment) studies on inoculation against online misinformation without having to worry about detrimental consequences for the effectiveness of the intervention.
With respect to real news items, we found a significant interaction effect between the item set and the intervention, which causes a negative overall effect. This can give the impression that the Bad News intervention has negative side effects by reducing trust in real news. However, this effect can be fully accounted for by the interaction between the specific item set and the intervention. Moreover, the pure inoculation effect was insignificant and showed the absence of any effect of interest using a TOST equivalence test with Cohen’s d = (−)0.30 as the SESOI. Since in Experiment 1 we did not find any effect for real news items either, we conclude that the Bad News game does not increase skepticism toward real news. However, we caution to give too much weight to this result, as the limited internal consistency of the real news items in combination with the potential item-specific effects makes it difficult to draw general conclusions.
One of the principle tenets proposed by Solomon (1949) was that given a large enough, randomly selected sample size, with known means and variances of a pretest for two groups (i.e., Groups 1 and 2), one can infer what the pretest result would be for a third group (i.e., Group 3). The inclusion of the traditional control group (i.e., Group 2, which only has a pre- and posttest without an intervention) presumably serves two purposes. First, at the time of Solomon’s writing, sample sizes of hundreds or even thousands of participants (which are achievable today through online interventions), were arguably unthinkable. As such, by averaging the pretest score of Group 2 with the pretest score of Group 1, researchers could reasonably assume a third pretest for Group 3 with a much larger sample size. This would allow researchers to determine the traditional within (i.e., pre- vs. posttest) analysis for Group 3. Second, the inclusion of Group 2 allows for the assessment of the unique influence of a pretest as well as the pretest × intervention on the posttest. For the former, in a tightly controlled, short duration, laboratory or online study, the difference between pretest and posttest without an intervention is likely to be minimal, if not zero (as was the case in this study). But more importantly, as is usually the case in psychological research, researchers are more concerned with the true influence of the intervention on the posttest score (i.e., Group 3), which can be isolated without the second group. We therefore argue, in agreement with Solomon’s original tenet, that if the primary concern is to determine the influence of an intervention on the posttest (when there is no pretest), a first control group is not necessary (i.e., Group 2).19 Instead, one would only need to include a group that went through the pretest, intervention, and posttest, and a group that only went through the intervention and posttest. As an example, had we only included Group 1 and Group 3 in this study, we would have observed a pretest × intervention interaction effect (which now includes the pretesting effect) leading to an inoculation effect mean difference of 0.11 instead of 0.08 (which excludes the pretesting effect), and the same corrected inoculation effect of a −0.52 decrease in reliability ratings of fake news after the Bad News game intervention.
For illustrative purposes, we used a concrete example of how careful attention to design effects can enhance the quality of psychological research on important real-world issues such as fake news, but we believe that the method and results outlined in this article are relevant to many psychological interventions in educational settings, from reducing prejudice and stereotypes, to work on memory and reaction times.
We do, however, note a number of limitations. In the item selection process for the item effects study, we did not correctly register the polarization badge for the majority of the sample,20 which led to reduced power for the item effect study compared with the preregistration (a post hoc power analysis yields a power of .76 to detect effect sizes of d = −0.30; for comparison, post hoc power is 0.96 for the same effect size for the testing effect study). However, in the two prior attempts at running this study (N1 = 2,408, N2 = 1,532) we found similar effects for each comparison, except for the Set B–Set B cross-group comparison. In both of these studies, we found a significant Set B–Set B effect with mean differences of −0.35 (t(1477) = −7.31, p < .001, d = −0.321) and −0.19 (t(1028) = −3.24, p = .001, d = −0.175). We thus have reason to see the results from the main study as valid, despite the reduction in power. See Supplementary Table S4 for a comparison of the hypothesis tests between the large data set (without polarization category) and the small data set (with polarization category). For the testing effects study, we used a mixed item set for the control group (Group 2). Both of these limitations occurred due to a selection error in the experiment. We corrected for this using multiple rigorous and transparent analyses (see the Supplementary Analyses S1 and S2, as well as Supplementary Materials S1), which show that the conclusions presented here are nonetheless robust.
In conclusion, game-based inoculation interventions are likely influenced by item effects, and not by testing effects. The inoculation effect generalizes across different item sets, with item effects being limited and small likely due to the use of sets that were not psychometrically standardized a priori. Pretest–posttest designs (both within-subject and between-subject) can be used, as well as between-subject posttest-only designs, to measure inoculation effects in the context of online misinformation. Only small descriptive testing effects were found, and our investigation suggests that these potential effects are rooted in an interaction between the specific item set and the intervention and are not due to a differential intervention effect on the general ability to spot misinformation techniques. Future research could help inform the extent to which these findings are generalizable to other psychological interventions.
Supplemental Material
Supplemental material, Roozenbeek_et_al._2020_-_supplement for Disentangling Item and Testing Effects in Inoculation Research on Online Misinformation: Solomon Revisited by Jon Roozenbeek, Rakoen Maertens, William McClanahan and Sander van der Linden in Educational and Psychological Measurement
Acknowledgments
We want to thank Dr Brendan Nyhan for his insights and comments.
The game is free and accessible online via www.getbadnews.com.
For a detailed description of the game and the various misinformation techniques participants learn about, please see Roozenbeek and van der Linden (2019).
The Bad News game is currently playable online in 15 different languages including German (www.getbadnews.de), Dutch (www.slechtnieuws.nl), Russian (www.getbadnewsrussian.com), Ukrainian (www.getbadnewsukraine.com), Swedish (www.badnewsgame.se), and Esperanto (www.misinformado.net).
Importantly, the test items are different from the “training set” the players are exposed to during gameplay.
Preregistration was done via AsPredicted.org for both the item effect study (https://aspredicted.org/kt4gm.pdf) and the testing effect study (https://aspredicted.org/wy59x.pdf). Some minor alterations were made as compared with the preregistration, which are described in Supplementary Declarations S1 and S2.
We note that because the game is free to play, and that individuals must “opt-in” to be part of the academic study, there is potential for self-selection bias (Campbell, 1957) at two points: at the decision to play the game and then again at the decision to “opt-in” the research. In addition, we were not able to control for participants’ country of origin, as consistent with GDPR guidelines and our ethics application, the in-game survey could not ask for this information.
We recognize that Solomon also proposed a four-group design, with the fourth group only receiving the posttest. However, in Solomon’s design, this fourth group is used to assess environmental factors that could explain mean difference scores between pre- and posttest due to factors such as a time delay or exposure to certain events. As discussed by Solomon (1949), since there is a minimal time delay between pre- and posttest in our study (approximately 15 minutes), the influence of the environment may be considered zero. As such, we did not deem it necessary to include a fourth group in this study.
Throughout this article, Groups 1, 2, and 3 refer to Solomon’s (1949) original three groups.
The treatment groups received item Set A with the polarization fake news item and the brands real news item of Set B, the control group received the complete Set B. This was the result of an error in the implementation of the in-game survey, but should have minimal influence on our results, as only the within-group differences are calculated for this group. To control for confounds because of this discrepancy, we have looked at the same analysis performed only with the shared items between all conditions, and find similar results. We therefore do not see this as a major limitation to the results presented here. See Supplementary Analysis S2 and Supplementary Figure S5 for a detailed overview.
We recognize that the sample is self-selected, as it only contains participants who visited the Bad News website.
Throughout this article, we refer to this outcome measure as “reliability judgments” following Basol et al. (2020) and Roozenbeek and van der Linden (2019). Here, we do not refer to “reliability” in the technical sense of the internal consistency of psychological measurements (e.g., Aldridge et al., 2017), but rather in the literal sense, as the perceived reliability of misinformation.
The AsPredicted.org preregistration can be found here: https://aspredicted.org/kt4gm.pdf, all alterations are explained in Supplementary Declaration S1.
A table with raw means can be found in Supplementary Table S3.
With a lower SESOI (d = 0.23; based on the effect size found for the Set B–Set B test; see Supplementary Table S4), statistical equivalence is no longer equal to zero, suggesting that the preregistered expected effect size of d = 0.30 was too high. All analyses were done in R with the TOSTER package (Lakens, 2017).
Formula used: (ScoreSetX,T2−MSetX,T1)/SDSetX,T1
The AsPredicted.org preregistration can be found here: https://aspredicted.org/wy59x.pdf, all alterations are explained in Supplementary Declaration S2.
We used a mixed item set (combination of Set A and Set B) for the control group; as explained above, this was an error in the implementation of the in-game survey. To control for confounds because of this, we have looked at the same analysis performed only with the shared items between all conditions, and find similar results, and therefore do not see this as a major limitation to the results presented here. See Supplementary Analysis S2 and Supplementary Figure S5 for a detailed overview.
The traditional Solomon Three Group analysis can be found in Supplementary Analysis S1.
When the following conditions are met: a sufficiently large sample size, random selection, and known variance and mean of one group (Solomon, 1949).
The first attempt did not include the polarization items, and the second included the same polarization item in both surveys, instead of two different items. Because of this, we decided not to include these data sets in our main analysis.
Footnotes
Authors’ Note: Part of this research was presented at the 2019 Harvard Kennedy School Shorenstein Center on Media, Politics and Public Policy’s “Comparative Approaches to Misinformation” workshop, held on October 4, 2019 at Harvard University.
The authors declared no potential conflicts of interest with respect to the research, authorship, and/or publication of this article.
Funding: The authors received no financial support for the research, authorship, and/or publication of this article.
ORCID iD: Jon Roozenbeek  https://orcid.org/0000-0002-8150-9305
Supplemental Material: Supplemental material for this article is available online.
References
- Aldridge V. K., Dovey T. M., Wade A. (2017). Assessing test-retest reliability of psychological measures: Persistent methodological problems. European Psychologist, 22(4), 207-218. 10.1027/1016-9040/a000298 [DOI] [Google Scholar]
- Banas J. A., Rains S. A. (2010). A meta-analysis of research on inoculation theory. Communication Monographs, 77(3), 281-311. 10.1080/03637751003758193 [DOI] [Google Scholar]
- Basol M., Roozenbeek J., van der Linden S. (2020). Good news about Bad News: Gamified inoculation boosts confidence and cognitive immunity against fake news. Journal of Cognition, 3(1), Article 2. 10.5334/joc.91 [DOI] [PMC free article] [PubMed] [Google Scholar]
- Campbell D. T. (1957). Factors relevant to the validity of experiments in social settings. Psychological Bulletin, 54(4), 297-312. http://rogosateaching.com/somgen290/campbell_1957.pdf [DOI] [PubMed] [Google Scholar]
- Carlsson U. (2019). Understanding media and information literacy (MIL) in the Digital Age: A question of democracy. https://jmg.gu.se/digitalAssets/1742/1742676_understanding-media-pdf-original.pdf
- Compton J. (2012). Inoculation theory. In The SAGE handbook of persuasion: Developments in theory and practice (pp. 220-236). 10.4135/9781452218410.n14 [DOI]
- Compton J. (2018). Inoculation against/with political humor. In Baumgartner J. C., Becker A. B. (Eds.), Political humor in a changing media landscape: A new generation of research (pp. 95-113). Lexington Books. [Google Scholar]
- Compton J. (2019). Prophylactic versus therapeutic inoculation treatments for resistance to influence. Communication Theory. Advance online publication. 10.1093/ct/qtz004 [DOI]
- Cook J., Lewandowsky S., Ecker U. K. H. (2017). Neutralizing misinformation through inoculation: Exposing misleading argumentation techniques reduces their influence. PLOS ONE, 12(5), Article e0175799. 10.1371/journal.pone.0175799 [DOI] [PMC free article] [PubMed] [Google Scholar]
- Eagly A. H., Chaiken S. (1993). The psychology of attitudes. Harcourt Brace Jovanovich. [Google Scholar]
- Ermert M. (2018). German hate speech legislation receives mixed review at German Internet Governance Forum. Intellectual Property Watch website. https://www.ip-watch.org/2018/11/28/german-hate-speech-legislation-receives-mixed-review-german-internet-governance-forum/
- Fazio L. (2020, February 10). Pausing to consider why a headline is true or false can help reduce the sharing of false news. Harvard Kennedy School Misinformation Review, 1(2). 10.37016/mr-2020-009 [DOI] [Google Scholar]
- Funder D. C., Ozer D. J. (2019). Evaluating effect size in psychological research: Sense and nonsense. Advances in Methods and Practices in Psychological Science, 2(2), 156-168. 10.1177/2515245919847202 [DOI] [Google Scholar]
- Gelman A. (2017). Poisoning the well with a within-person design? What’s the risk? https://statmodeling.stat.columbia.edu/2017/11/25/poisoning-well-within-person-design-whats-risk/
- Guess A., Nagler J., Tucker J. (2019). Less than you think: Prevalence and predictors of fake news dissemination on Facebook. Science Advances, 5(1). 10.1126/sciadv.aau4586 [DOI] [PMC free article] [PubMed] [Google Scholar]
- Hao K. (2018, October 3). Even the best AI for spotting fake news is still terrible. MIT Technology Review. https://www.technologyreview.com/s/612236/even-the-best-ai-for-spotting-fake-news-is-still-terrible/
- Human Rights Watch. (2018, February 14). Germany: Flawed social media law. https://www.hrw.org/news/2018/02/14/germany-flawed-social-media-law
- Lakens D. (2017). Equivalence tests: A practical primer for t tests, correlations, and meta-analyses. Social Psychological and Personality Science, 8(4), 355-362. 10.1177/1948550617697177 [DOI] [PMC free article] [PubMed] [Google Scholar]
- Lakens D., McLatchie N., Isager P. M., Scheel A. M., Dienes Z. (2020). Improving inferences about null effects with Bayes factors and equivalence tests. Journals of Gerontology: Series B, 75(1), 45-57. 10.1093/geronb/gby065 [DOI] [PubMed] [Google Scholar]
- Lakens D., Scheel A. M., Isager P. M. (2018). Equivalence testing for psychological research: A tutorial. Advances in Methods and Practices in Psychological Science, 1(2), 259-269. 10.1177/2515245918770963 [DOI] [Google Scholar]
- Lewandowsky S., Ecker U. K. H., Cook J. (2017). Beyond misinformation: Understanding and coping with the “post-truth” era. Journal of Applied Research in Memory and Cognition, 6(4), 353-369. 10.1016/j.jarmac.2017.07.008 [DOI] [Google Scholar]
- Lewandowsky S., Ecker U. K. H., Seifert C. M., Schwarz N., Cook J. (2012). Misinformation and its correction: Continued influence and successful debiasing. Psychological Science in the Public Interest, 13(3), 106-131. 10.1177/1529100612451018 [DOI] [PubMed] [Google Scholar]
- Livingstone S. (2018, August 5). Media literacy—Everyone’s favourite solution to the problems of regulation. Media Policy Project Blog. http://blogs.lse.ac.uk/mediapolicyproject/2018/05/08/media-literacy-everyones-favourite-solution-to-the-problems-of-regulation/
- McGuire W. J. (1964). Some contemporary approaches. Advances in Experimental Social Psychology, 1, 191-229. 10.1016/S0065-2601(08)60052-0 [DOI] [Google Scholar]
- McGuire W. J., Papageorgis D. (1961. a). Resistance to persuasion conferred by active and passive prior refutation of the same and alternative counterarguments. Journal of Abnormal and Social Psychology, 63(2), 326-332. 10.1037/h0048344 [DOI] [Google Scholar]
- McGuire W. J., Papageorgis D. (1961. b). The relative efficacy of various types of prior belief-defense in producing immunity against persuasion. Journal of Abnormal and Social Psychology, 62(2), 327-337. 10.1037/h0042026 [DOI] [PubMed] [Google Scholar]
- Nyhan B., Reifler J. (2012). Misinformation and fact-checking: Research findings from social science. https://www.dartmouth.edu/~nyhan/Misinformation_and_Fact-checking.pdf
- Ozbay F. A., Alatas B. (2020). Fake news detection within online social media using supervised artificial intelligence algorithms. Physica A: Statistical Mechanics and Its Applications, 540, Article 123174. 10.1016/j.physa.2019.123174 [DOI]
- Pennycook G., Bear A., Collins, Evan T., Rand D. G. (2020). The implied truth effect: Attaching warnings to a subset of fake news headlines increases perceived accuracy of headlines without warnings. Management Science. Advance online publication. 10.1287/mnsc.2019.3478 [DOI]
- Pieters J. (2018, March 6). Dutch politicians want EU anti-fake news watchdog scrapped. https://nltimes.nl/2018/03/06/dutch-politicians-want-eu-anti-fake-news-watchdog-scrapped
- Roozenbeek J., van der Linden S. (2018). The fake news game: Actively inoculating against the risk of misinformation. Journal of Risk Research, 22(5), 570-580. 10.1080/13669877.2018.1443491 [DOI] [Google Scholar]
- Roozenbeek J., van der Linden S. (2019). Fake news game confers psychological resistance against online misinformation. Palgrave Communications, 5, Article 65. 10.1057/s41599-019-0279-9 [DOI] [Google Scholar]
- Roozenbeek J., van der Linden S., Nygren T. (2020, February 3). Prebunking interventions based on “inoculation” theory can reduce susceptibility to misinformation across cultures. Harvard Kennedy School (HKS) Misinformation Review, 1(2). 10.37016//mr-2020-008 [DOI] [Google Scholar]
- Solomon R. L. (1949). An extension of control group design. Psychological Bulletin, 46(2), 137-150. 10.1037/h0062958 [DOI] [PubMed] [Google Scholar]
- Song M. K., Ward S. E. (2015). Assessment effects in educational and psychosocial intervention trials: An important but often-overlooked problem. Research in Nursing & Health, 38(3), 241-247. 10.1002/nur.21651 [DOI] [PMC free article] [PubMed] [Google Scholar]
- Tandoc E. C., Jr., Lim Z. W., Ling R. (2018). Defining “Fake News.” Digital Journalism, 6(2), 137-153. 10.1080/21670811.2017.1360143 [DOI] [Google Scholar]
- van der Linden S., Leiserowitz A., Rosenthal S., Maibach E. (2017). Inoculating the public against misinformation about climate change. Global Challenges, 1(2), Article 1600008. 10.1002/gch2.201600008 [DOI] [PMC free article] [PubMed] [Google Scholar]
- van der Linden S., Maibach E., Cook J., Leiserowitz A., Lewandowsky S. (2017). Inoculating against misinformation. Science, 358(6367), 1141-1142. 10.1126/science.aar4533 [DOI] [PubMed] [Google Scholar]
- van der Linden S., Roozenbeek J. (2020). Psychological inoculation against fake news. In Greifenader R., Jaffé M., Newman E., Schwarz N. (Eds.), (pp 147-169). The psychology of fake news: Accepting, sharing, and correcting misinformation.Psychology Press. [Google Scholar]
- Vosoughi S., Roy D., Aral S. (2018). The spread of true and false news online. Science, 359(6380), 1146-1151. 10.1126/science.aap9559 [DOI] [PubMed] [Google Scholar]
- World Economic Forum. (2018). Digital wildfires. http://reports.weforum.org/global-risks-2018/digital-wildfires/
Associated Data
This section collects any data citations, data availability statements, or supplementary materials included in this article.
Supplementary Materials
Supplemental material, Roozenbeek_et_al._2020_-_supplement for Disentangling Item and Testing Effects in Inoculation Research on Online Misinformation: Solomon Revisited by Jon Roozenbeek, Rakoen Maertens, William McClanahan and Sander van der Linden in Educational and Psychological Measurement