| jupyter | ||||||||||||||||||||||||||||||||||||||||||||||||||||||||||||||||
|---|---|---|---|---|---|---|---|---|---|---|---|---|---|---|---|---|---|---|---|---|---|---|---|---|---|---|---|---|---|---|---|---|---|---|---|---|---|---|---|---|---|---|---|---|---|---|---|---|---|---|---|---|---|---|---|---|---|---|---|---|---|---|---|---|
|
Create an empty FigureWidget and then view it.
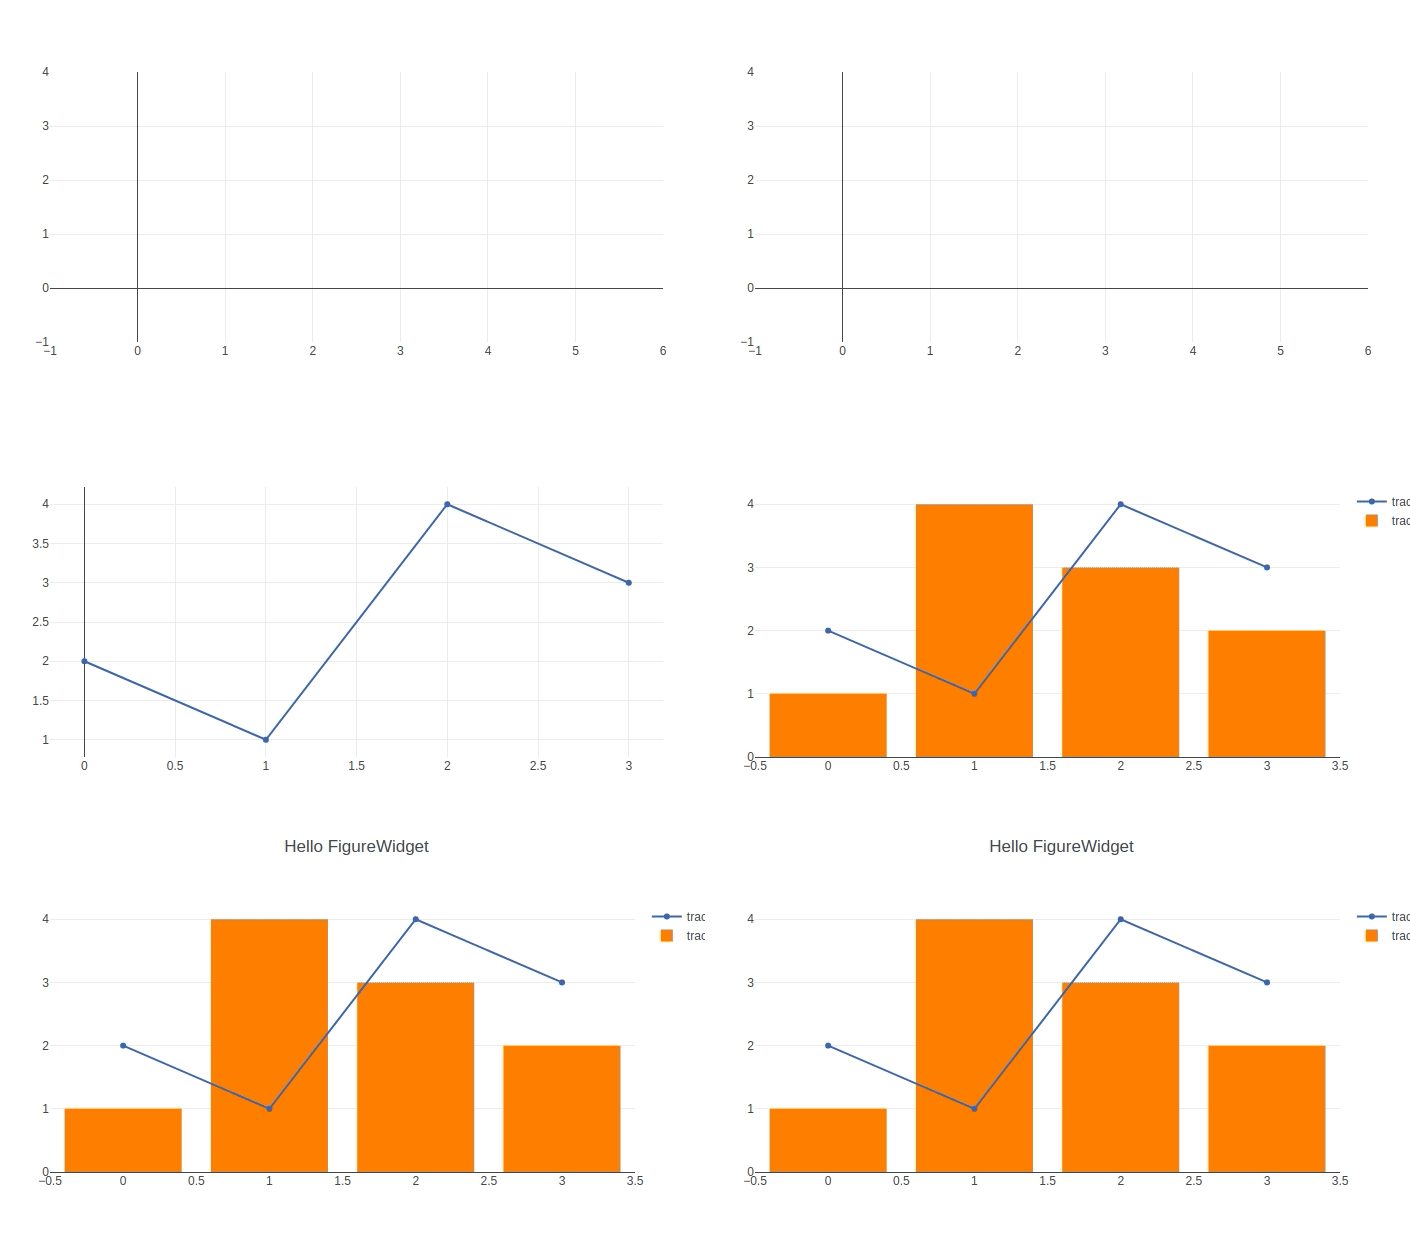
importplotly.graph_objectsasgof=go.FigureWidget() fAdd traces or update the layout and then watch the output above update in real time.
f.add_scatter(y=[2, 1, 4, 3]);f.add_bar(y=[1, 4, 3, 2]);f.layout.title='Hello FigureWidget'# update scatter datascatter=f.data[0] scatter.y= [3, 1, 4, 3]# update bar databar=f.data[1] bar.y= [5, 3, 2, 8]f.layout.title.text='This is a new title'A standard Figure object can be passed to the FigureWidget constructor.
importplotly.graph_objectsasgotrace=go.Heatmap(z=[[1, 20, 30, 50, 1], [20, 1, 60, 80, 30], [30, 60, 1, -10, 20]], x=['Monday', 'Tuesday', 'Wednesday', 'Thursday', 'Friday'], y=['Morning', 'Afternoon', 'Evening']) data=[trace] layout=go.Layout(title=dict(text='Activity Heatmap')) figure=go.Figure(data=data, layout=layout) f2=go.FigureWidget(figure) f2See these Jupyter notebooks for even more FigureWidget examples.
help(go.FigureWidget)
