jupyter jupytext kernelspec language_info plotly notebook_metadata_filter text_representation all
extension format_name format_version jupytext_version .md
markdown
1.1
1.1.7
display_name language name Python 3
python
python3
codemirror_mode file_extension mimetype name nbconvert_exporter pygments_lexer version .py
text/x-python
python
python
ipython3
3.6.5
description display_as language layout name order page_type permalink thumbnail Click Events With FigureWidget
chart_events
python
base
Click Events
4
example_index
python/click-events/
thumbnail/figurewidget-click-events.gif
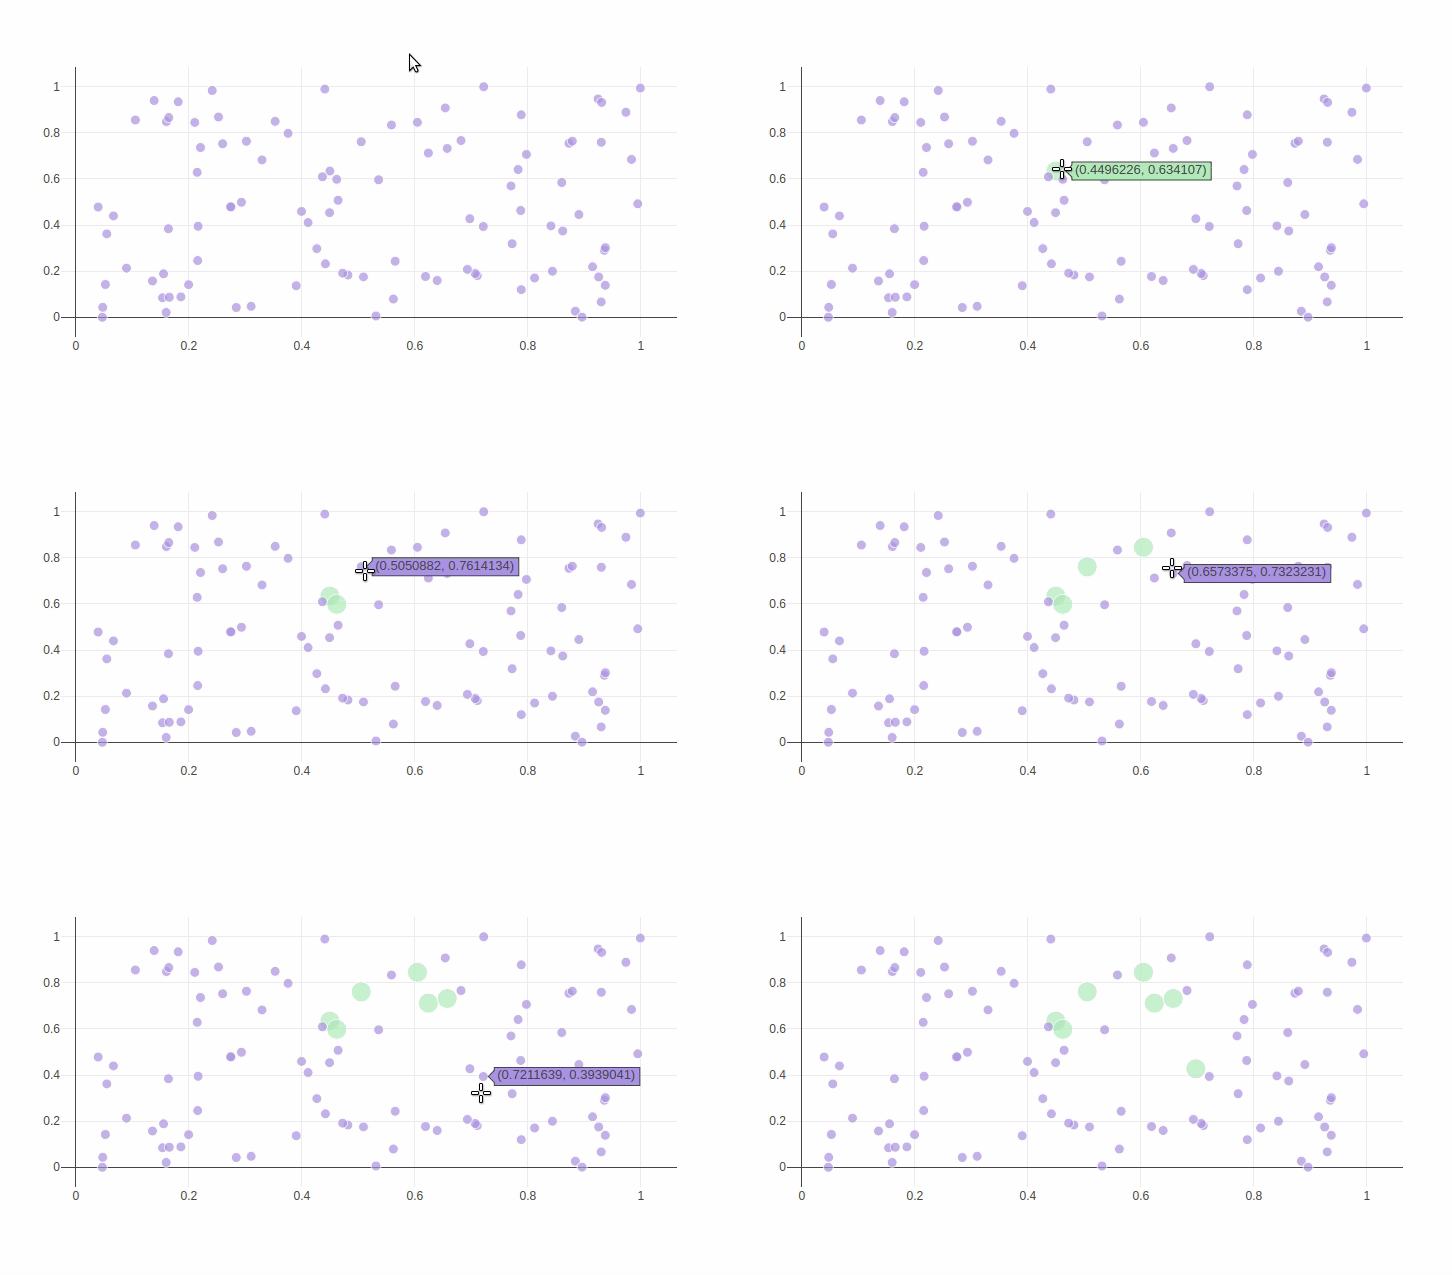
Update Points Using a Click Callback import plotly .graph_objects as go import numpy as np np .random .seed (1 ) x = np .random .rand (100 ) y = np .random .rand (100 ) f = go .FigureWidget ([go .Scatter (x = x , y = y , mode = 'markers' )]) scatter = f .data [0 ] colors = ['#a3a7e4' ] * 100 scatter .marker .color = colors scatter .marker .size = [10 ] * 100 f .layout .hovermode = 'closest' # create our callback function def update_point (trace , points , selector ): c = list (scatter .marker .color ) s = list (scatter .marker .size ) for i in points .point_inds : c [i ] = '#bae2be' s [i ] = 20 with f .batch_update (): scatter .marker .color = c scatter .marker .size = s scatter .on_click (update_point ) f
See these Jupyter notebooks for even more FigureWidget examples.
import plotly .graph_objects as go f = go .FigureWidget ([go .Scatter ()]) help (f .data [0 ].on_click )