


When observability is brought up, many assume it will...
Read MoreNew report: "Taking Observability to the Next Level: OpenTelemetry's Emerging Role..." Download here

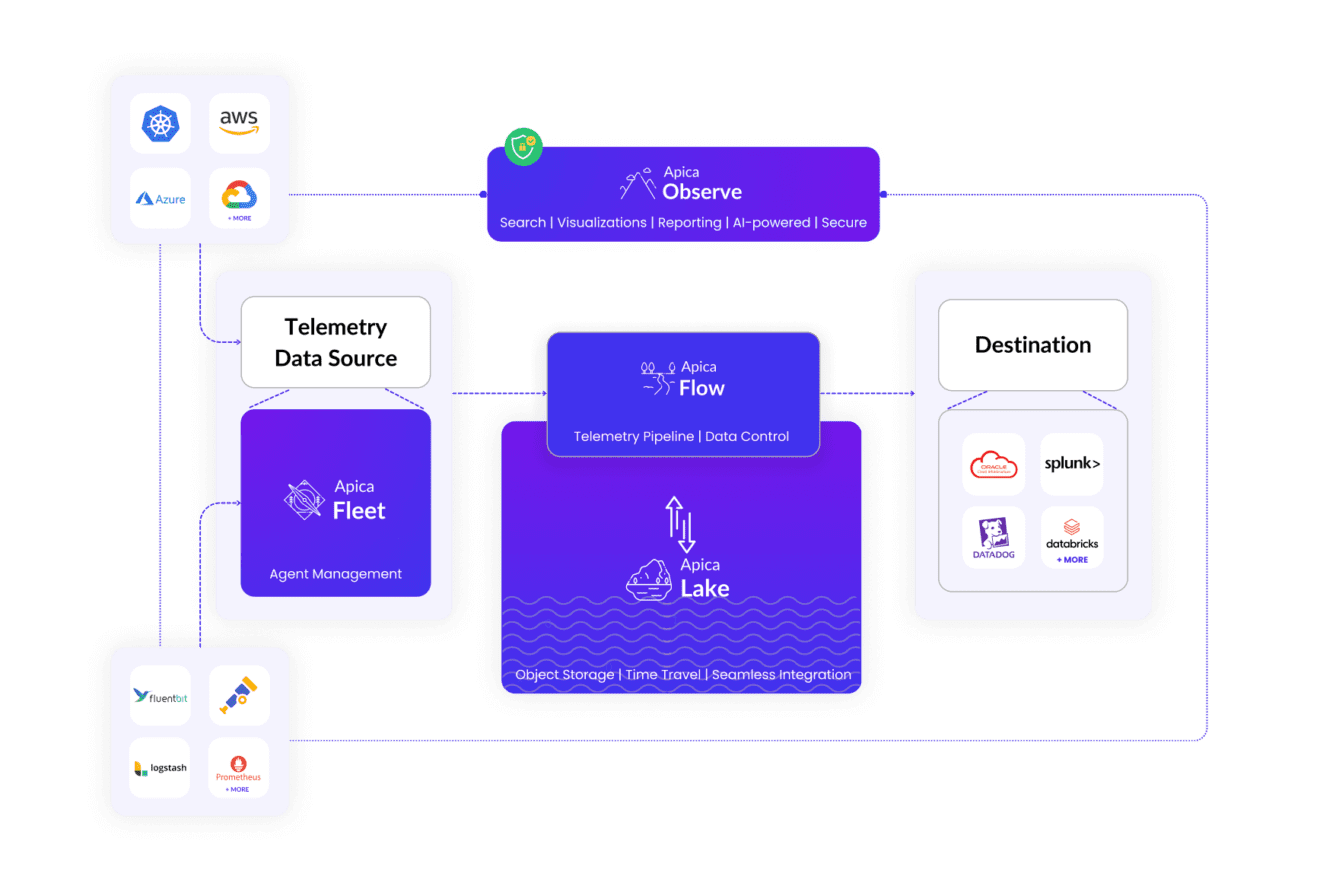


Build your observability data lake with a single log aggregation tool that enables you to collect, optimize, analyze, route, and manage log data across your entire stack at any scale.
Collect, optimize, store, transform, route, and replay your observability data – whenever, wherever you need it.
Gain from exhaustive and all-inclusive real-time monitoring for all your applications powered by Prometheus. More insights. More affordable. Less hassle.
Gain from exhaustive and all-inclusive real-time monitoring for all your infrastructure components powered by Prometheus. More insights. More affordable. Less hassle.
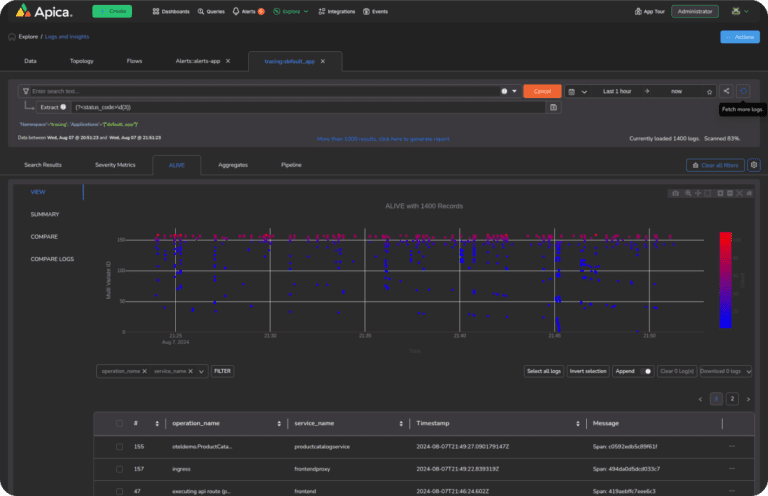
Troubleshoot and analyze performance issues with Apica’s OpenTelemetry and Jaeger-compatible Distributed Tracing implementation.
Converge all of your data in one place and get real-time access to the data for operational and analytical needs. Simpler data governance with zero setup and maintenance cost. No unnecessary movement or migration of data.
Tailored for enterprises, our robust monitoring tool delivers predictive insights into the performance and uptime of your critical assets – websites, applications, APIs, and IoT.
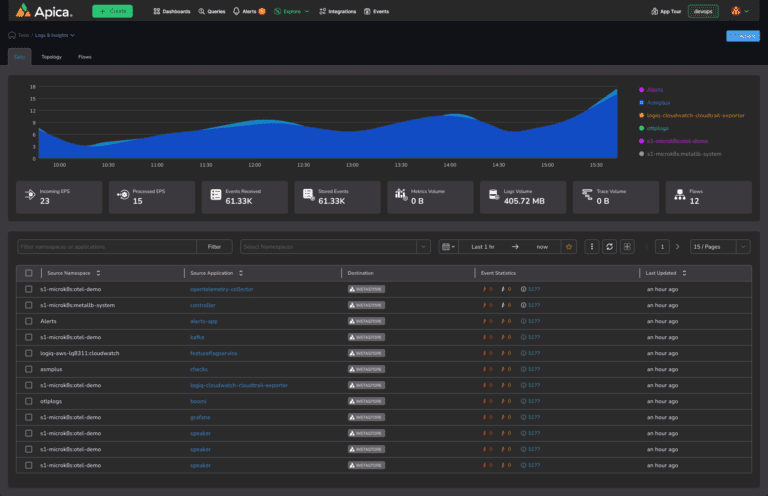
Complete Kubernetes observability with the ability to ingest logs and metrics from Kubernetes components, pods, nodes, and user applications and observe your entire Kubernetes ecosystem through a single interface.
Proactively monitor applications and/or microservices to identify problems and fix them before they become serious issues.
Constantly monitor your network to proactively identify problems such as slow traffic or component failure. Leverage Prometheus-based agents to stay on top of your network performance.
Seamlessly apply machine learning and natural language processing to your observability data and automatically identify anomalies, detect patterns and determine causalities.
Analyze your API flows, troubleshoot issues, and understand API usage. Enable development, operations, and security teams to work together to deliver world-class applications.
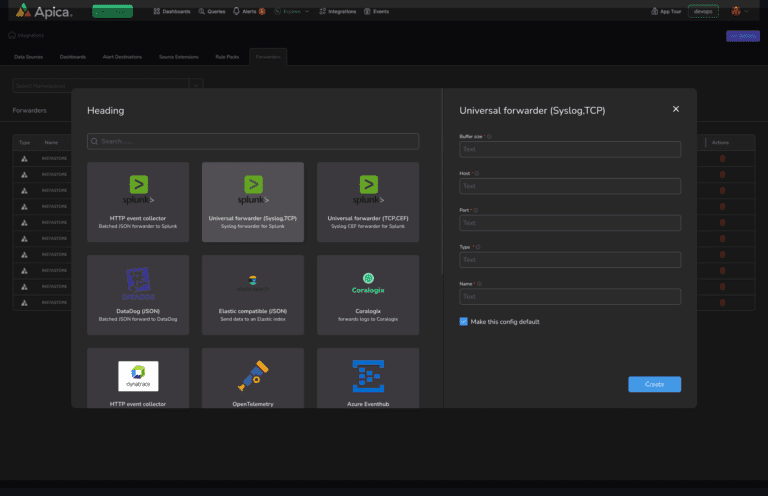
Use Apica to instrument, generate, collect, and export telemetry data (metrics, logs, and traces) to help analyze software performance and behavior.
1-Click compliance and governance. Leverage any object store to retain and index observability data for months or years with linear performance.
Leverage Apica’s wide range of tools, techniques and automation to quickly identify root cause of issues and anomalies.
Apica Ships With A Built-In, Powerful, And Flexible Events And Alert Management Engine That Helps Reduce The Noise In Your Alerts. Use Our Simple UI To Create Programmatic Rules That Can Detect Critical Issues In Your Infrastructure In Real-Time.
Build your observability data lake with a single log aggregation tool that enables you to collect, optimize, analyze, route, and manage log data across your entire stack at any scale.
Collect, optimize, store, transform, route, and replay your observability data – whenever, wherever you need it.
Gain from exhaustive and all-inclusive real-time monitoring for all your applications powered by Prometheus. More insights. More affordable. Less hassle.
Gain from exhaustive and all-inclusive real-time monitoring for all your infrastructure components powered by Prometheus. More insights. More affordable. Less hassle.
Troubleshoot and analyze performance issues with Apica.AI’s OpenTelemetry and Jaeger-compatible Distributed Tracing implementation.
Converge all of your data in one place and get real-time access to the data for operational and analytical needs. Simpler data governance with zero setup and maintenance cost. No unnecessary movement or migration of data.
Real-time detection of security events, automation to trigger remediation workflows with.
Built-in Security, ready to protect your enterprise from threats, malware, and ransomware.
Complete Kubernetes observability with the ability to ingest logs and metrics from Kubernetes components, pods, nodes, and user applications and observe your entire Kubernetes ecosystem through a single interface.
Proactively monitor applications and/or microservices to identify problems and fix them before they become serious issues.
Constantly monitor your network to proactively identify problems such as slow traffic or component failure. Leverage Prometheus-based agents to stay on top of your network performance.
Seamlessly apply machine learning and natural language processing to your observability data and automatically identify anomalies, detect patterns and determine causalities.
Analyze your API flows, troubleshoot issues, and understand API usage. Enable development, operations, and security teams to work together to deliver world-class applications. Learn More About API Observablity
Use Apica to instrument, generate, collect, and export telemetry data (metrics, logs, and traces) to help analyze software performance and behavior. Learn More About Telemetry Best Pratices
1-Click compliance and governance. Leverage any object store to retain and index observability data for months or years with linear performance.
Leverage Apica.AI’s wide range of tools, techniques and automation to quickly identify root cause of issues and anomalies.
Apica Ships With A Built-In, Powerful, And Flexible Events And Alert Management Engine That Helps Reduce The Noise In Your Alerts. Use Our Simple UI To Create Programmatic Rules That Can Detect Critical Issues In Your Infrastructure In Real-Time.